
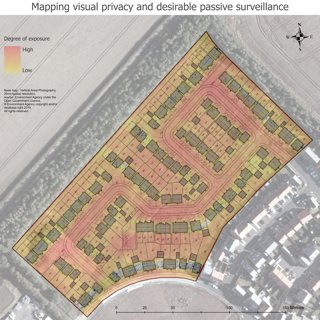
Mapping visual exposure and desirable passive surveillance
What story does this visualisation tell?
Visual exposure can be used as a measure of privacy in buildings or areas that surround them. For example, it can assess the impact on privacy in a garden overlooked by other houses, or whether a neighbour can directly see into a property.
This visualisation shows a way to assess impacts of proposed residential developments on privacy in residential garden. Here the focus is on garden areas, but this approach could be useful to architects, developers, planners and stakeholders in designing well thought out spaces and contributing to community safety.
Why was it created?
Understanding privacy is an important part of the planning process. Currently, Local Planning Authorities undertake assessments based on standards and guidance rather than quantitative analysis for an individual situation.
This is an alternative. This analysis illustrates the extent of visual exposure across a proposed development.
Who was the intended audience?
This approach is intended to be used by Local Planning Authorities to understand the visual exposure of properties in new developments and to make decisions, in the planning process, on whether this is acceptable.
It can also aid planning inspectors in settling disputes about privacy in residential areas and assessing evidence where planning permission has been refused based on considerations of privacy and overlooking.
There is potential for this be a valuable tool for architects or landscape designers when designing layouts, testing different layout options, or even demonstrating the design quality of layouts during the planning application process.
What data did you use to create it and why?
Two datasets were required for this work: (1) a surface model that represented the proposed development and (2) the geographic location (x,y,z) of all proposed windows to represent viewpoints.
In order to generate this, the following data were sourced:
-
Digital Terrain Model - A LiDAR composite DTM was obtained from the Environment Agency under the Open Government Licence. The purpose of this data was to provide elevation information of the study area. The dataset had a 1m spatial resolution and a vertical accuracy of +/- 0.15m Root Mean Square Error (RMSE).
-
Proposed residential development drawings - The architectural drawings for the proposed development were obtained from the Newark and Sherwood District Council planning portal. These included:
-
Proposed site layout drawings to extract location information for all proposed buildings, gardens, and fences.
-
Proposed elevation and section drawings to extract location and height information for all proposed buildings and windows.
-
Proposed site levels plan, to extract height information of the proposed finished floor levels for all buildings on the site.
-
-
Vertical aerial photograph and site boundary coordinates - A vertical aerial photograph of the study area was obtained from the Environment Agency under the Open Government Licence. This was obtained for the purpose of geo-referencing or spatial adjustment. The site boundary coordinates for the study area were also sourced from Newark and Sherwood District Council’s planning portal and used as additional control points for geo-referencing or spatial adjustment.
Why did you choose to present the data in this way over other approaches?
The analysis has been plotted onto a map which shows graduated colours to indicate the level of privacy. This presentation, very similar to a density surface, helps make the analysis easy to interpret.
If someone wanted to recreate a similar style of visualisation, how would they go about it?
Anyone wanting to create this style of visualisation must first familiarise themselves with the cumulative and probabilistic visibility analysis approaches. One starting point is my conference paper from the 30th GISRUK conference which outlines this process. All data required can be sourced openly through local planning authorities and the open government data websites.
How can the visualisation be taken a step further?
The next step for this visualisation is to incorporate visual attenuation with distance. This will account for the reduction in visibility as distance from the viewpoint increases by incorporating decay functions which represents the factors that affect visibility, such as atmospheric conditions or human visual limitations. Such a development would allow this application to be useful in large scale developments.
Collins Terkpetey-Hushie is Senior Geospatial Analyst in the British Army Corps of Royal Engineers and GIS trainer/lecturer at the Defence School of Geospatial Intelligence, UK MOD. His background is in architecture and the built environment. He also specialises in spatial-temporal data analytics and science. You can follow and find out more about his work on LinkedIn