How are urban retail spaces changing?
In many towns the commercial enterprises on which their high streets were founded are now a distant memory. Urban retail spaces have been sites of exponential rates of change. In some cases, change has been defined by growth, as shopping has become a regular and enjoyable leisure activity for many. In other areas, change has been led by the decline in physical retail spaces with the rise and dominance of online retail space. These concepts make urban retail spaces fantastic fieldwork sites, with lots of geographical dynamics to explore and issues that are widely relatable to students.
Specification links
Edexcel A 4.5 Recent changes in retailing and their impact on the chosen UK city: decline in the central business district (CBD), growth of edge- and out-of-town shopping and increasing popularity of internet shopping).
Edexcel B 5.5 How parts of the city have experienced decline (deindustrialisation, de-population): de-centralisation (out-of-town shopping centres, retail and business parks), e-commerce, developments in transport.
Eduqas A 2.2.3 Economic, cultural and technological factors that have led to changes in retailing. Costs and benefits of the development of out of town shopping and internet shopping. A study of high street change in UK towns/cities.
Eduqas B 1.2.4 The cause and effect of change in retailing (shopping). Changes in where shops are located to include the decline of shopping areas within CBDs and the rise of out of town retail parks.
Data Collection
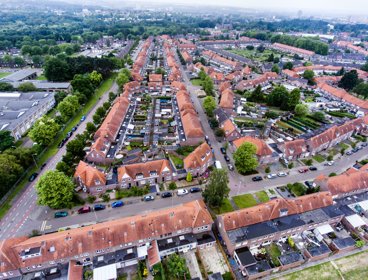
Location: An urban area with a high street and at least one other retail space such as a out-of-town retail park.
Time required: Half day
Equipment list: Data collection sheets; Clipboard
Pre-trip preparation:
Through the use of the date sliders on Digimaps (Login to Digimap for Schools (edina.ac.uk)) or Google Street View, students should gain knowledge about how key retail spaces at their urban field site have changed overtime. Changes students should note include the types of shops and their size as well as the construction of new developments and changes such as the pedestrianisation of certain roads.
Students should also have a broad understanding of where the urban area sits against the national picture in terms of deprivation and standard of living (through Indices of Deprivation 2015 and 2019 (communities.gov.uk)). This will give them a wealth of background information through which they can contextualise the primary data they collect in the field.
Even a brief search through back copies of a local newspaper (in print or online) will undoubtedly reveal some of the micro scale issues that local retail spaces have faced. Through searches like this, students will become more aware of how changes in urban retail spaces do not happen passively and there are many agents, often competing, in the process.
Tasks and activities
Students should start by conducting a land use survey of each distinct retail area in the urban space. These might include
-
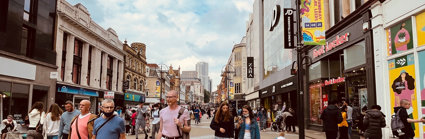
High streets
-
Shopping centres
-
Boutique parades
-
Big box store parks
-
Out of town retail areas
As students walk through these areas and using a Goad map (downloadable through Digimaps, above) students can create maps that through the use of different colours and a key, show which buildings house chain stores and which have independent stores in them, as well as marking on empty stores and those in short term leases such as temporary Christmas shops. This would help students to identify if there are clusters of store types in different parts of the town.
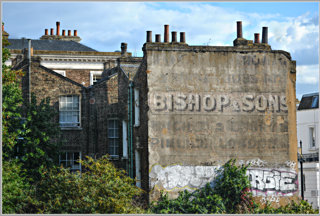
Students should also examine the physical aspects of the buildings in the different retail spaces. Shop size and age can be key indicators when investigating change. There are a number of ways of measuring shop size and the proxy method chosen depends on the practicality of executing certain methods within the local conditions. Based on the idea that one large stride is roughly one metre in length, students can pace out each shop frontage and record that figure as a proxy measure of size. Students can also record features such as the number of storeys or the number of doors customers can use as a way of determining building size. Building age can be estimated by looking for certain features such as chimneys and lead or bay windows, as well as the size and number of windows in the building above the shop frontage itself. Ghost adverts (below) can also be noted along with any store which has clearly resulted from two or more shops being knocked through into one.
These observations should be done in all retail spaces being investigated. Students should use their land use map to record these shop sizes individually so that one can marry up the size of the shop with how it is defined by land use category.
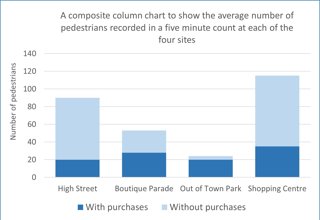
Comparisons between the different retail spaces should also cover how busy each is. Synchronised pedestrian counts should take place over five minutes at each site and, if possible, at different times of the day. Students might like to add an additional measure into their pedestrian count by noting how many people are carrying bags of purchases.
Data Presentation
With students making comparisons between different retail spaces in the same town, there is a good opportunity for them to site all their primary data on a map of the town, making comparative analysis between the different sites much easier. A number of elements of the data collection phase result in data that are expressed as single figures:
-
Clone town score (see data analysis section)
-
Average size of shops
-
Empty shops as a percentage of the total number
-
Pedestrian counts
-
Percentages of pedestrians observed with purchases
These elements can be sited on a map, using proportionately sized symbols to show their relative values.
The pedestrian counts can also be shown as a composite column graph, with the number of pedestrians observed with purchases also included (below).
Students can use the Goad map on which they recorded the retail land use and shop size data to create a data table which lists the land use and the average shop size in each category. There are a number of secondary ways of presenting this data (such as a simple column chart) but by digitally downloading images of each retail land use category (independent; chain; empty and temporary lease) students can create a more visually exciting pictogram with the images resized to show their average shop front length at the different field sites.
Data Analysis
To engage students with the concept of the homogenisation of retail spaces, a clone town analysis can be carried out. Born from research conducted by the New Economics Foundation, this simple analysis (see link below) examines to what extent a retail space is a replica of every other in the UK and the extent to which they are dominated by well known chain stores. From this analysis a clone town score can be generated and used to quantify this phenomenon.
The large amounts of quantitative data created by the data collection phase can be used to create detailed, number driven descriptions of each of the retail spaces under consideration. Students can comment on which areas could be viewed as ‘successful’ retail spaces, with a large number of footfalls (and people actually purchasing goods) as well as being able to offer a diverse range of shops.
For a more advanced form of statistical data analysis, students could carry out a Chi-Squared test (see link below) which compares real, observed data with that which would be expected if no geographical reasoning were applied. An example of a Chi-Squared contingency table is given below. In this case, students can compare the number of stores of different sizes in each retail space with the predicted numbers. This would show if there is a meaningful association between the size of a store and where it is found.
|
Size of frontage (m) |
High street |
Boutique parade |
Out of Town retail park |
Shopping Centre |
TOTAL |
|
0 to 2 |
|
|
|
|
|
|
2 to 4 |
|
|
|
|
|
|
4 to 6 |
|
|
|
|
|
|
6 to 8 |
|
|
|
|
|
|
8+ |
|
|
|
|
|
|
TOTAL |
|
|
|
|
|