
How do different sections of the population feel about our climate future?
Climate change is a synonymous theme throughout every topic studied in today’s geography classrooms, yet one which does not easily lend itself to fieldwork since the causes and effects of climate change are often on such a large scale that they are impossible for students to measure with any meaningful results. However, canvassing opinions on climate change futures is one area which investigative skills can be used in any setting and so called ‘clipboard fieldwork’ should be recognised for the value it can add to students skills in the enquiry process.
Though the nature of this particular fieldwork investigation is rooted in attitudes towards climate change there is nothing to stop teachers from applying these same methods to other areas of the course that involve divided opinions and contemporary issues.
Specification links
Edexcel B 9.6 How different groups (consumers, TNCs, governments, climate scientists and environmental groups) have contrasting views about energy futures (business as usual versus sustainable).
Eduqas B 2.4.4 Differing views, values and attitudes which are held on the issue of climate change and the ways in which its effects could be addressed.
Data Collection
Location: Not location specific
Time required: One homework period
Equipment list: A questionnaire, either in a digital or paper format
Pre-fieldwork preparation:
It is so easy in the teaching of climate change to teach from a position of activism and to preach to students the way that their and everyone’s lives have to change in order to create a better climate future worldwide – and this is a popularist viewpoint for good reason as few geographers would argue against the need for drastic action and change. However, our students need to develop skills which allow them to simultaneously understand multiple viewpoints around complex issues such as climate change and exploring these is vital if we are going to have meaningful change.
In preparation for this clipboard fieldwork study therefore, students need to be briefed in the idea that just because they disagree with a viewpoint does not mean they should not explore it further to try and understand it. Equally, students need to understand that there is no simple solution to climate change, for if there were it would not be the issue it currently is.
Tasks and activities
For this form of fieldwork, students should play a central role in the design of a questionnaire that gauges different people’s opinions on actions needed to create a better climate future. The general flow of the questionnaire should be, firstly, to establish a profile of the respondent in terms of gender, age, and socioeconomic background, then to find out how much they know about climate change and the actions needed to mitigate its impacts, followed finally by a ranking exercise in which they select different mitigating actions (either at a personal or government level) and place them in order of preference for their circumstances.
An essential element in the design of the questionnaire is that each individual response can be tracked. This means that each respondent needs to be given their own number code to identify them and information cannot simply be tallied as a total.
The actual data collection phase can then take part in two stages. In the first students would carry out a pilot study in which they would test the questionnaire on their peers or people in their household. Students should then rewrite the questionnaire following this activity, paying close attention to how they have used geographical words and phrasing and how the data they have generated from their pilot questionnaire matches the type of data they were expecting to gather. Students should be encouraged to be open about the shortfalls in their questionnaire and recognise that the key to getting good data is to create good questions in the first place.
Key areas that students might need to think about in the design of their questionnaire include:
-
Whether real ages are needed or just age brackets
-
How to phrase questions around gender to ensure that everyone is included and able to answer
-
Whether questions around socio-economic status are intrusive or simply proxy indicators of status
-
How they can deal with people who are basing their ‘knowledge’ on misinformation and media hype
-
How people might realistically be able to rank mitigating actions to climate change if they do not have prior knowledge of particular schemes
In the second phase of the data collection, students should aim to generate at least twenty responses each to their questionnaire, sampling as wide a cohort of people as possible. Students can explore whether they believe a systematic, random or stratified sample might be the best way of generating this cohort.
Data Presentation
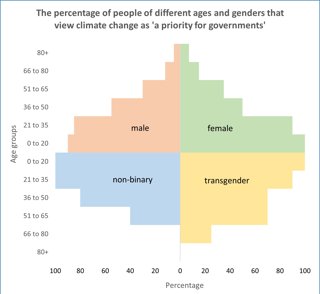
Given the large amounts of quantitative data generated by the questionnaires responses, there are a wealth of simple data presentation techniques that students can draw upon. Pie charts, column charts and pictograms can all be used to show different elements of the data. More complex data representations can combine different elements of the data sets together or compare them on one set of axes. A traditional population pyramid for example can be repurposed to show how many people in different age groups and of different genders believe certain elements about climate change futures (below).
Similarly, students could compare how the different mitigating actions were ranked by producing a composite percentage column chart: a column chart with a separate column for each mitigating action where each column itself is split by the percentage of the different rankings assigned to them in total.
Data Analysis
Students can track opinions through the questionnaire using the unique number code assigned to each respondent. This means they can see how all people in one age group, for example, answered one question or how all the people who ranked one mitigation measure highly thought about a separate question. It is best done using a spreadsheet application, and though this process can be a little time-consuming, it can produce some very interesting results, especially if the sample size is large as it would be in this case.
It can be difficult when faced with all the data in a spreadsheet, to know where to start with tracking. For students inexperienced in this technique it is best to begin by trying to prove or disprove a hypothesis they might have. For example, students may believe that ‘people who understand the least about climate change mitigation will also be least willing to make changes to their personal behaviour’. With this hypothesis in mind, students should then highlight any respondent who falls into the lowest category of climate change comprehension and track their responses to following questions that ask them about how they rank mitigation strategies (such as ones relating to a range of ways they can change their own behaviour). Students will then be able to see whether there is a notable correlation in the way that these respondents think about their own behaviour and responsibility.
Using the data from the questionnaire concerned with demographic characteristics, students might like to create people profiles and plot them against each other in a conflict matrix. For each square of the matrix, students can analyse data from the questionnaire and decide if the type of respondents agree or disagree with each other. In additional the extent of that agreement or disagreement can be expressed as a number score (such as -3 to +3). This will allow students to see if there are certain groups of people who think alike when it comes to climate change futures and begin discussions about why certain groups, though different demographically might show a consensus of opinion.