How do the characteristics of a river change from source to mouth?
Schools with relative ease of access to a river may be able to use it to good effect to teach the fundamental principles of the Bradshaw model. The river does not have to be dynamically perfect in order to teach this as the basic principles of how the characteristics of a river might change from source to mouth are conceptually straight forward and students can imagine a perfect river model even if other geographical variables come into play during the fieldwork stage which make the river appear to contradict the Bradshaw model.
Specification links
AQA: 3.1.3.3 The long profile and changing cross profile of a river and its valley.
Edexcel A: 1.7 How river landscapes contrast between the upper courses, mid courses and lower courses of rivers and why channel shape (width, depth), valley profile, gradient, discharge, velocity and sediment size and shape change along the course of a named UK river.
Edexcel B: 4.6 How river landscapes contrast between the upper courses, mid-courses and lower courses of rivers and why channel shape (width, depth), valley profile, gradient, discharge, velocity and sediment size and shape change along the course of a named UK river.
Data Collection
Location: A local river (with easy and safe access into the water itself).
Time required: Full day
Equipment list: Ranging poles; Clinometers; Organic float (such as an orange or dog biscuit) OR Flow meter; Tape measure; Callipers OR 30 cm ruler; Metre stick; Timing device; Data collection sheets; Clipboards.
Pre-trip preparation:
With a number of different processes due to take place in the field, it might be sensible to allow students to handle the different pieces of equipment beforehand and to run through how each is used and what they will be used for in the field. Though safe working practices will be emphasised at the field site as students enter the water, it would also be a good idea to highlight these in the classroom too, along with clear instruction as to what constitutes appropriate footwear and clothing for the activities.
Students should use an OS map to identify the precise field sites they will be visiting to record their data. Students can note geographical variables and factors (such as the size and shape of the valley sides) that will likely influence the characteristics of the river itself.
Tasks and activities
Each of the following activities should take place at each of the different field sites, ideally covering the upper, middle and lower course of the river. All data can be recorded in raw form for processing later in the classroom.
Students can measure a number of dimensions of the river channel. Width at both bankfull (bank top to bank top) and low flow (along the water’s surface) can be measured by stretching a tape measure across the channel. At the same time, students can measure the bankfull and low flow depths at regular intervals across the channel using a metre stick.
To enable students to measure the cross sectional area of the river channel, the wetted perimeter (the length of the river channel from bank to bank that is under water) is a useful measure. Students should secure the measuring tape on one bank and tread along the tape as they make their way to the other bank. This ensures that the small scale ridges and depressions along the river bed are accounted for. The wet section of the tape can be measured as can the full length of the tape from bank to bank, taking into account the bankfull wetted perimeter.
The gradient of the channel can be measured using two ranging poles and a clinometer. Positioning the poles so that they are perpendicular and equidistant either side of the section of river used to measure width, the gradient can be measured between these two points. The clinometer is placed on one of the ranging poles at the junction between a white and red painted section. Pointing the clinometer at the same position on the opposing pole will give the students a gradient recording.
Keeping the poles in these positions, students can then measure velocity. A float is placed in the river at the upstream pole and the time taken to float to the second pole (where the float is retrieved) is recorded, along with the distance between the ranging poles. It is recommended that students measure velocity a number of times to create an average figure. Likewise, a digital flow metre might be placed in the river facing upstream, which will give an automatic reading for velocity at the point of entry.
Finally, students may wish to measure bedload size and roughness. A random sample of twenty pieces of bedload can be picked blind from the river bed. The longest length on each piece of bedload can be measured and using the Powers scale, students can score each piece of bedload according to roughness.
It is always good practice for students to complete a fieldsketch at each river site and note any geographical observations of the area that may explain particular data.
Data Presentation
Given that students are recording the characteristics of a river at three points along its course, it makes sense for them to create sited graphs and charts and plot them onto a map at the appropriate locations. A common technique to use in river studies is to draw a channel cross section (below). This is basically a line graph of changing depth, but with the line drawn beneath the x-axis and with the depth represented by minus figures. This means the channel is shown as it would appear in real life.
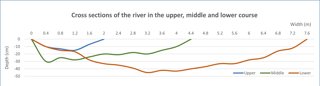
Likewise students can plot the cross section of the three courses on the same set of axes for ease of comparison.
If the students are fortunate enough to have managed to collect data from more than three sites, or if it is possible to combine together the findings from different working groups to create a larger set of data, it may be plausible to create scattergraphs of different elements of the data. For example, according to the Bradshaw model, as channel gradient decreases, velocity decreases and students would be able to see if this is true by plotting these variables against each other.
River bedload at each site could be compared by converting the different categories within the sample into percentages. For example, the size of the bedload can be split into groups (less than 5cm long; 5 to 10cm long; 10 to 15cm long etc) and the percentage of bedload that falls into each category can be calculated. From this students can draw percentage bars or pie charts to represent the relative amounts of bedload in each category at each of the three sites.
Data Analysis
River data lends itself very well to students carrying out a Spearman’s Rank Correlation Coefficient. As the purpose of the river study may be to see to what extent the chosen fieldtrip river relates to the Bradshaw model, the results from a Spearman’s Rank test can give the students a more dynamic answer than just that which can be interpreted from their data presentation. In order to carry out a Spearman’s Rank, the students must have a minimum of ten pairs of data, for example, ten average depth readings paired with ten velocity readings for each of those depths. Where it is not possible to collect this volume of primary data, secondary data could be used to create a suitably sized data set. It is important to remember that the stats test is there to assist the geographical thinking and not test a student’s mathematical abilities. Spearman’s Rank calculators are available online and students can use these to quickly find results before spending time geographically interpreting them.
Outside of statistical testing, students can still draw large amounts of understanding about river characteristics from source to mouth simply through looking at each variable and examining how it changes over the courses of the river. Students can compare these changes with the Bradshaw Model (right) and where contradictions occur (or where the observed changes in characteristics are not thought to be particularly strong) students can look at other geographical variables (such as flood management strategies) that may have had an influence on river dynamics.
Students can also use the raw data to calculate further river data such as river discharge (cross sectional area × velocity) and hydraulic radius (cross sectional area ÷ wetted perimeter). These can then be compared with other river systems through the use of secondary data available through the National River Flow Archive. Students can also find their own river through that site and compare the primary data they found with data collected in a different season or that collected after a major rain event.
Bradshaw Model
Increases from source to mouth:
• Channel depth
• Channel width
• Flow velocity
• Discharge
• Hydraulic radius
Decreases from source to mouth:
• Channel gradient
• Size of bedload
• Roughness of bedload
- Fieldwork

A student guide to the A Level independent investigation (Non-examined Assessment - NEA)
Download a copy of our guide
- Fieldwork
Rivers fieldwork techniques
This section introduces a range of techniques that you can use for fieldwork in river environments
- Data skills
River landscapes
The fluvial system: lessons using data skills