• Login
  • Join Us
Royal Geographical Society with IBG
  • About us
  • Geography
  • Schools
  • Professionals
  • In the field
  • Research
  • What's on

Search the Society

Enter keyword or phrase...
Find
Royal Geographical Society with IBG
Back to Climate 4 Classrooms

Climate 4 Classrooms

Climate4classrooms provides curriculum linked teaching resources about climate change for pupils

  • Key Stage Three,
  • Key Stage Four,
  • Key Stage Five,
  • Module,
  • The carbon and water cycles, climate and change
  • Overview
  • What is climate change?
  • What causes climate change?
  • What evidence do we have of climate change?
  • How do we predict the future?
  • What will the future look like?
  • Your climate
  • How is your temperature changing?
  • How are your seasons changing?
  • How will precipitation change?
  • Climate change in your community
  • Mitigation and adaptation
  • National futures

What is climate change?

This module will help students to understand:

  • What is climate?

  • What global and local influences affect climate?

  • What is meant by climate change?

Climate change means any significant change in climate, like temperature or rainfall, over a 30 year period or more. If the climate is changing, then the 30 year average temperature, or rainfall, or number of sunny days, is changing.

It is easy to mix up climate and weather.

Here’s a simple way to think about it: climate is what we expect (e.g. cold winters) and weather is what we get (e.g. rain).

Weather is what is happening in the atmosphere at any one time: how warm, windy, sunny or humid it is. Climate is the description of the average weather we might expect at a given time, usually taken for several decades or longer to average out year to year variability. Variability might be due to a particularly hot summer or very cold winter.

The world’s climate has been getting warmer since 1900.  However, this overall warming has not occurred evenly across the world’s surface and different places, because of their location and geography, are affected in different ways.

The average air temperature of the Earth’s surface from 1850 – 2008


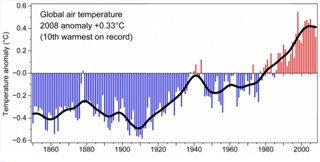
Source: Climatic Research Unit, University of East Anglia (2008) 1: Global Temperature Record. [Accessed June 2009]

  • This graphic shows the average temperature of the Earth’s surface from 1850-2008

  • The horizontal, x, axis shows time in years from 1850-2008

  • The vertical, y, axis shows how different the temperature is from the average of 1961-1990

  • Each red bar shows the world’s ‘weather’ for that year. The black line shows the changing ‘climate’

  • The climate has been getting warmer since 1900


Downloads

  • What Is Climate Change? Teachers' Notes (.pdf)
  • What Is Climate Change? Teachers' Notes (.doc)
  • What Is Climate Change? Student Activities (.pdf)
  • What Is Climate Change? Student Activities (.doc)
  • Download all

Login

Sign in
Forgotten password

Or continue as a guest...

By placing a booking, you are permitting us to store and use your (and any other attendees) details in order to fulfil the booking.
We will not use your details for marketing purposes without your explicit consent.

Continue

This content is restricted

You must be a member holding a valid Society membership to view the content you are trying to access. Please login to continue.


Not a member? Find out how to join

Join us today, Society membership is open to anyone with a passion for geography

Find out more

Address

Royal Geographical Society
(with the Institute of British Geographers),
1 Kensington Gore,
London, SW7 2AR

Registered Charity, 208791

E enquiries@rgs.org

T +44 (0)20 7591 3000
 

Follow us

We are the learned society for geography and geographers. Be part of our community by following us on our social media accounts.

  • twitter
  • youtube
  • linkedin
  • facebook
  • instagram

Links

  • MYSOCIETY LOGIN
    Vacancies
    PRESS AND MEDIA
    HIRE OUR VENUE
    PRIVACY NOTICE
    Accessibility
    SITE MAP

  •  

Cookies on the RGS website This site uses cookies to enhance your user experience.