
Lesson two: Data analysis
Key question
How can ocean acidification data be analysed and presented?
Aim
To handle data collected during Dr Findlay’s ocean acidification research visit to the Arctic Ocean, including:
-
Setting of a hypothesis for the data set used
-
Presentation of data in graphical form
-
Statistical analysis of data
-
Written analysis and explanation of findings
Starter
Watch the video clip 'In the field' which highlights some of the challenges of collecting data in the Arctic region.
In the field - Video clip
Discuss the following questions with your group:
-
What other challenges do you think researchers face living on the frozen ice of the Arctic Ocean for two months?
-
What characteristics would it be important for a researcher collecting this type of data to have?
-
What are the positives of an experience like this? Why do you think researchers dedicate so much time to collecting and analysing scientific and geographical data?
You will be analysing data collected in these conditions for the remainder of the lesson.
Main Activity
In this lesson, you will be using the Spearman’s Rank Correlation Coefficient statistical test. This is used to show the strength and significance of the relationship between two variables, for example, the relationship between the GNP of a country and its birth rate. In this case, you will be investigating the relationship between different variables such as temperature, pH and dissolved organic carbon in the Arctic seawater samples collected by Dr Findlay during her research investigation.
The equation for Spearman’s Rank Correlation Coefficient is:
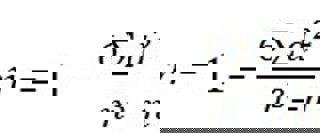
You need a data set (sample size) of at least 15 for the test to work.
If you are new to Spearman’s Rank, download the example, which shows you how it works. The example investigates the relationship between total alkalinity and pH in Arctic sea water samples. It also tells you how you can complete Spearman’s Rank in Excel, although you’ll need to know how to do the calculations yourself for your exam.
Now it’s your turn
The exam question is based on the AQA Geographical Skills Paper (Unit two), but the techniques are useful practice for students of all boards.
The question forms half of an actual paper, which means that you should be allowed 30 minutes to complete it. You are allowed to use a calculator.
Plenary
When you have completed your exam question, swap with your partner and use the mark scheme to assess each other’s work. This is really useful practice for you as it makes you aware of the way papers are marked, and what the examiners are looking out for.
The total number of marks that can be awarded for the question is 25.
How did you do? If you think you could do with some more practice with Spearman’s Rank, there are two more data sets you can work on, with answers so you can check how you have done.
Do not forget to spend some time analysing the results of your Spearman’s Rank calculations. You will need to determine the significance level and see if you can explain the relationship you have identified. The information on the geography fieldwork website will help you to do this.
You can also read Dr Findlay’s explanations about why the correlations occur in the document provided.
Other documents and links
-
OA Spearman’s Rank Excel Guide document
-
OA correlation explanations document
-
Geography fieldwork website - Spearman's Rank Correlation Coefficient