The Hunga Tonga-Hunga Ha'apai 2022 volcanic eruption
The specification
AQA A Level 3.1.5 Hazards. 3.1.5.3 Volcanic hazards: pyroclastic and ash fallout, gases/acid rain, tephra.
Edexcel A Level Topic 1: Tectonic Processes and Hazards. 1.1 c. The causes of intra-plate earthquakes, and volcanoes associated with hot spots from mantle plumes.
OCR A Level Topic 3.5 – Hazardous Earth. 2.b. Volcanic eruptions generate distinctive hazards. Different types of volcanic eruptions and the different types of hazards they generate including lava flows, pyroclastic flows, gas emissions, tephra, and ash.
WJEC A Level 1.3: Tectonic Hazards. 1.3.2 Volcanoes, processes, hazards, and their impacts. Types of volcano including shield, composite and cinder and types of volcanic eruption including explosive and effusive.
The volcano
In January 2022, the Hunga Tonga-Hunga Ha'apai volcano erupted in the Pacific Ocean, just 65 kilometers north of Nuku‘alofa, the capital city of the Kingdom of Tonga.
The event began in December 2021, but this particularly large eruption didn’t occur until 5:15pm local time on 15 January 2022, see Figure 1.
The event has been captured by multiple satellites and is the first of its kind to erupt and persist in the modern era, according to the NASA Goddard Space Flight Centre, giving scientists an unprecedented view of its evolution from space.
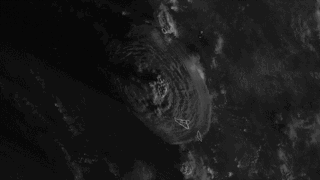
Figure 1 satellite imagery 13 January © NOAA, the Tongan capital is the main island to the bottom right
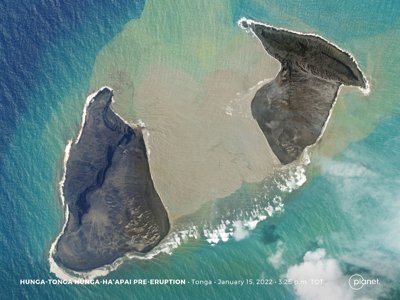
The Hunga Tonga-Hunga Ha'apai volcano is situated on an uninhabited island. The name of the volcano describes the two once separate islands — Hunga Tonga, and Hunga Ha’apai. These twin islands were linked together following an earlier 2014-2015 eruption. Over the past decade volcanic activity has increased on the island, leading to this once-in-a-millennium event. The New Scientist reported the volcano’s explosion as ‘its most powerful eruption since AD 1100’.
Hunga Tonga-Hunga Ha'apai is now a submarine volcano, as the recent eruption on 15 January caused its cone to collapse, lowering the previous summit beneath the water’s surface. Hunga Tonga-Hunga Ha'apai is now described on the Smithsonian Institution’s Global Volcanism Program with a 114-metre summit, and 374-feet elevation.
Much is still unknown about the volcano. However, scientists are now investigating the characteristics of the eruption. The eruption was extremely explosive. From the first explosion in 2015, scientists at the NASA Goddard Space Flight Centre say they were reminded of the Island of Surtsey in Iceland. Since 2015, the island has been shaped and enlarged by ongoing Surtseyan eruptions, adding new ash, and growing the volcanic cone.
The key feature of this volcano is the discovery of a caldera beneath the islands.
The cause
Hunga Tonga-Hunga Ha'apai erupted because it is a submarine volcano located on the Pacific Ring of Fire (a ring around the Pacific Ocean characterised by active volcanoes and frequent earthquakes). The volcano is situated on a convergent plate boundary where the Pacific Plate is being subducted by the Indo-Australian Plate, see Figure 2.
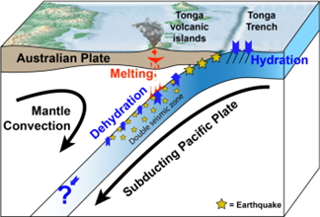
Figure 2 the interaction of the tectonic plates under Hunga Tonga-Hunga Ha'apai © S. Shawn Wei
Figure 2 shows the complex interaction between the two tectonic plates, with mineral dehydration occurring deep in the Tongan subduction zone, causing earthquakes and eruptions in the Tonga volcanic islands.
In January 2015, the volcanic island rose from the sea after the first explosive eruption in 53 years (previously it has been two separate unhabituated landmasses; Hunga Tonga and Hunga Ha'apa). The Earth witnessed the birth of the new larger volcanic island called Hunga Tonga-Hunga Ha'apai, shown in Figure 4. To gain a better understanding of the nature of a submarine volcano watch the short 3D elevation model by Frédérik Ruys, What lies beneath?
Since the most recent eruption of January 2022 Hunga Tonga-Hunga Ha'apai has returned to being two islands, shown in Figure 5.
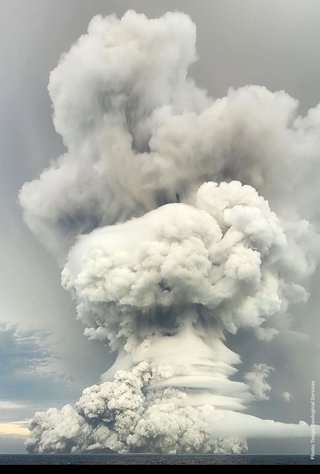
Figure 3 the eruption © Taaniela Kula (DS, Ministry of Lands & Natural Resources),
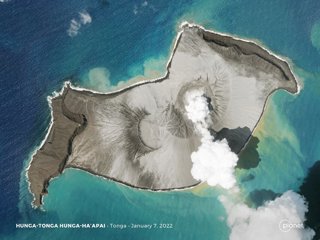
Figure 4 a plume of smoke rising from the underwater volcano days before the eruption © Planet SkySat
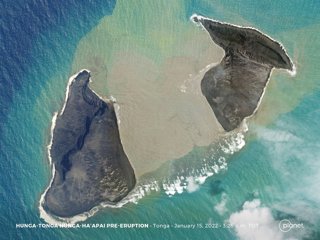
Figure 5 the above-water portion of the volcano is now almost completely obliterated © Planet SkySat
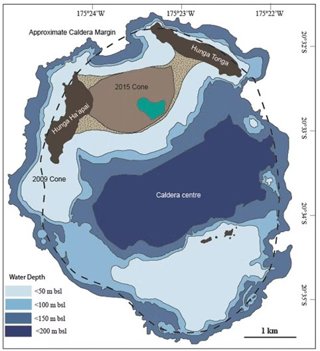
Figure 6 Hunga-Ha’apai and Hunga-Tonga submarine volcano and caldera © Shane Cronin The Conversation
The eruption
The Hunga Tonga-Hunga Ha'apai created a pressure (sound) wave that went around the world at least 4 times in visible Earth Observation data, shown in Figure 7.
The wave itself was recorded at below the threshold for human hearing however in some places audible sound was reported. The pressure waves were so strong they were even detected by barometers at the MetDesk HQ in Buckinghamshire, as shown in the Pascal (Pa) graph in Figure 8. This graph also shows the subsequent drop in pressure after the spike. It was reported that the pressure waves observed during the eruption were still being registered at 22:00 on 15 January as pressure waves rolled past, ‘much like an atmospheric tsunami’.
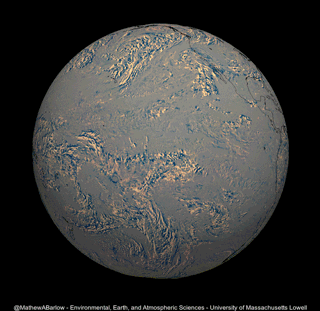
Figure 7 the pressure wave © Mathew Barlow
It is important to use the term pressure rather than shock wave because if the latter were generated, they would rapidly change nature to a linear acoustic wave (although they still may have been present near the source at time of the onset of the event).
The eruption on 15 January was large enough to make the whole atmosphere resonate. This generated yet another type of very low frequency oscillation known as gravity waves. Similar oscillations were only reported in a handful of other cases, like the eruptions of Pinatubo in 1991 and El Chichon 1982.
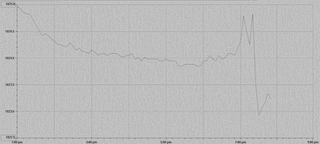
Figure 8 an extraordinary rise and then sudden drop in pressure © Met Office MetDesk
The plot above shows 1-minute MSL pressure data from the home observatory of Dr Stephen Burt FRMetS – a visiting Fellow to the University of Reading’s Department of Meteorology. The first big pressure wave arrived at 18:43 GMT and peaked at 19:22.
The eruption is reported to have occurred at 04:10 GMT. The great circle distance from the eruption to Reading is about 16,200 km. The elapsed time from eruption to the first wave in Reading was thus 14 hours and 33 minutes, indicating an average speed of about 1120 km p/h or 310 m/s. This is close to the speed of sound.
There were numerous subsequent waves evident in the unsettled trace for almost 12 hours afterwards. Some scientists have drawn parallels with the Krakatoa eruption of 1883 when the atmosphere was said to be 'ringing like a bell' for a couple of days afterwards.
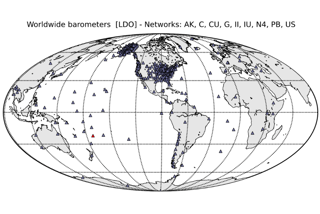
Figure 9 a map of microbarographs installed in different countries around the world © Dr Silvio De Angelis
Infrasound analysis
Dr Silvio De Angelis, a specialist in infrasound measurements of volcanic eruptions at the University of Liverpool, provided the following details about the sound waves of the Hunga Tonga-Hunga Ha'apai eruption.
Atmospheric pressure perturbations caused by the eruption were recorded by virtually every microbarograph in the world. Figure 9 on the previous page shows a selection of microbarographs, which are part of national monitoring networks in different countries worldwide and for which data are publicly available.
Figure 10 below shows the data recorded by all those microbarographs. This type of plot, which is commonly referred to as a record section, shows the propagation of pressure waves as they travel at increasingly greater distance from their source. The horizontal direction identifies time, in seconds, after the onset off the eruption. The vertical direction represents distance from the source (i.e., the site of eruption). Distance, or offset, in this plot is measured in degrees; a value of 0 represents the site of eruption and a value of 180 represents its antipode, that is its exact opposite on the globe. The lines seen in the Figure identify times when pressure waves generated by the eruption would be expected to be observed at a given distance from the source.
These calculations were performed assuming a constant sound speed of 310 m/s. While this is a reasonable approximation for quick calculations, the speed at which sounds propagates in the atmosphere changes both in time and space and it is affected by factors such as temperature and winds. Figure 10 shows that the pressure waves generated by the eruption circled the globe multiple times; some clever filtering of the data has allowed researchers to identify as many as four passages of the waves at many locations worldwide. At each of these sites the microbarographs recorded what we call direct and antipodal arrivals, that is pressure waves that followed the shortest route between the eruption site and the instruments, and those that travelled in the opposite direction around the globe.
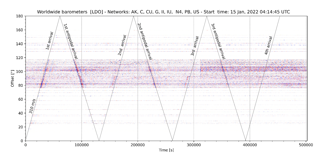
Figure 10 a plot showing the propagation of atmospheric pressure waves generated by the eruption
The pressure released by this eruption was one of the largest ever recorded instrumentally. Estimates of the energy released by the event are still ongoing but preliminary findings suggest that the pressure perturbation generated by the Hunga Tonga-Hunga Ha'apai 2022 eruption is comparable the most significant past events for which pressure data are available such as Pinatubo in 1991, El Chichon in 1982 and Krakatoa in 1883.
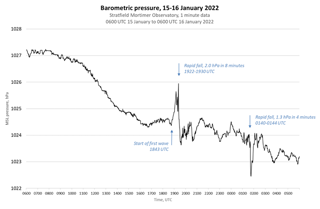
Figure 11 barometric pressure © Dr Stephen Burt FRMetS Visiting Fellow University of Reading
Ashfall analysis
Dr Sarah Henton De Angelis, a specialist in volcano geology and petrology at the University of Liverpool, provided the following details about ashfall associated with the eruption.
Volcanic ash is one of the major hazards associated with volcanic eruptions. Ash is unique among volcanic hazards because it can act over wide spatial and temporal ranges; from local to global, and from immediate to long-term.
Images from satellites show that vast ‘umbrella’ ash cloud from Hunga-Tonga reached 500 km across. This is one of the largest volcanic ash clouds recorded since satellite remote sensing technology was first developed in the second half of the 20th century. Ash was injected high into the stratosphere (which starts at ~15 km altitude); once in this layer, ash particles are able to travel for long distances; as such, eruptions in which large volumes of ash are injected into the stratosphere are sometimes able to impact on global climate, causing global cooling on a scale of years or even decades for the largest events (e.g., the 1815 eruption of Mt. Tambora). While data analysis is ongoing, estimates from NASA’s Cloud-Aerosol Lidar and Infrared Pathfinder Satellite Observations (CALIPSO) mission place small part of the Tonga ash at record-breaking 39.7 km altitude; some other estimates extend as high as 60 km above the Earth’s surface (for reference, space starts at ~100 km altitude). As the ash particles jostled around each other in atmosphere, they generated electrical charge that resulted in 400,000 lightning bolts.
However, evidence suggests that ash from the Hunga-Tonga eruption will not have a long-term or significant global impact, for two main reasons.
Firstly, the absolute volume of ash was actually relatively small given the size of the eruption. Scientists believe that the explosivity was probably driven by magma interacting with water, rather than because the magma volume itself was very large.
Secondly, the amount of SO2 (sulphur dioxide) released during the eruption was relatively small compared with that from other large eruptions. In 1991, the eruption of Mt. Pinatubo (the second largest eruption of the 20th century) injected a large volume of SO2 into the stratosphere, with some estimates reaching up to 15 million metric tonnes. The SO2 interacted with water to form aerosols that spread around the world, causing global cooling for several years. Current estimates suggest that the Hunga-Tonga eruption released a tiny fraction of SO2 in comparison (~400,000 metric tonnes).
Figure 12 below was taken on January 16, 2022, by the NASA Cloud-Aerosol Lidar and Infrared Pathfinder Satellite Observations (CALIPSO) mission. It shows the volcanic plume high in the stratosphere.
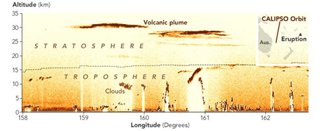
Figure 12 an illustration of volcanic plume height © NASA CALIPSO mission
However, even if the eruption has negligible global and long-term impacts, the ash emissions have already had significant local impacts. Thick layers of ash settled over the islands of Tonga, including the main island, Tongatapu, on which the capital city of Nukuʻalofa is located. While the most serious structural damage was caused by the tsunami (i.e., destroyed buildings), the ash also caused some damage.
Moreover, ash contaminated drinking water supplies, and affected transportation (e.g., roads and runways, stopping important aid supplies from arriving) and industry (e.g., agriculture and fisheries). Ash particles are formed of tiny shards of volcanic glass and minerals, and when taken into the lungs, these ash particles can cause long-term health problems.
Further reading
-
Scott Manley YouTube Volcanic Eruption May Be Biggest Ever Seen From Space
-
New Scientist Volcano eruption in Tonga was a once-in-a-millennium event
-
EOS the December 2014 eruption New Volcanic Island Unveils Explosive Past
-
National Geographic The Tonga eruption explained, from tsunami warnings to sonic booms
-
Frédérik Ruys, What lies beneath?
-
NASA Goddard The Birth of a New Island
-
Reuters Explainer: Tonga’s volcanic eruption may harm environment for years, scientists say
-
SPACE How satellites have revolutionized the study of volcanoes
Thank you to Dr Sarah Henton De Angelis and Dr Silvio De Angelis, from the Department of Earth, Ocean and Ecological Sciences at the University of Liverpool
This resource was first published in 2022.