
How do buildings affect different elements of a microclimate?
Studying microclimates through fieldwork is an excellent way of using the school site to explore not only the different elements of weather and climate but also the connection between the built environment and climate change, flooding in urban areas and aeolian processes. Many of the activities outlined below can be repeated in different time frames for students to further appreciate the impact of seasons and preceding weather on the observations made.
Schools can use this fieldwork to create a decision making exercise for students based on their school environment. Posing real world questions such as ‘where might we place a new bench for students?’ or ‘which part of the school should have solar panels / wind turbine?’ can engage students in new ways and make the fieldwork, and the geography, become applied and have a purpose.
Specification links
Eduqas A 5.2.2 Factors that influence micro-climate.
Data Collection
Location: Around the school site, including the school field
Time required: A double lesson
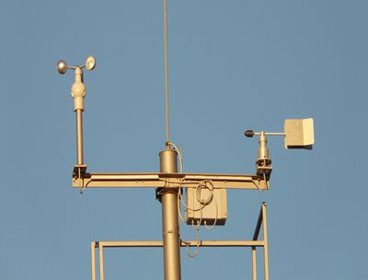
Equipment list: Surface (probe) thermometer; Liquid in glass thermometer; Anemometer; Compass; Clipboard; Data recording sheets
Pre-trip preparation:
It is likely that much of the equipment that students would be handling in the field will be new to them and so it is good idea for them to spend time practicing using the equipment before heading out around the school site.
Students should also study a map of the school site and note down on it any anecdotal evidence they themselves have of places which might be very windy, sunny or have extremes of temperature. Students can use this information to think about how the juxtaposition of different buildings might influence these variables. In addition students should have a broad understanding of the albedo effect and be able to list the different ways in which buildings can influence temperature such as through surface texture and colour.
Tasks and activities
Prior to departure from the classroom, around fifteen to twenty data collection points should be allocated at locations around the school site. These should include
-
Alleyways and relatively closed off spaces
-
Areas of shade and of moving sunlight
-
Open areas such as the playground and the school field
-
Areas alongside linear structures such as walls and hedgerows
-
Areas that have lots of glass, brick, concrete and painted surfaces in different colours
At each site (which can be allocated as one per pair of students) students should examine a number of factors:
-
The nature of the ground material (such as grass, bare soil, concrete, astroturf etc) and its colour
-
The nature of the material of the nearest vertical structure (such as brick, glass, vegetation etc) and its colour
-
The distance to the nearest vertical structure in each direction (N, E, S, and W)
-
Estimated height of the nearest vertical structure (unless in an open space)
-
The wind speed
-
The surface temperature of the ground (using a surface thermometer)
-
The surface temperature of the nearest vertical structure (unless in an open space)
-
The air temperature (using a liquid in glass thermometer)
On returning to the classroom, students should collate their data together so that each student has data for the whole of the school site.
Data Presentation
Students can take any data connected to surface types (material and colour) and create a map of the school site based on heat reflectivity. Each surface colour and texture should be given a score based on how reflective or absorptive it can make a surface. A score for each surface, including the ground surfaces at the school site can then be calculated. This score can then be used to create a colour scale which can be used to shade the map. These scores can further be used in graph work. Reflectivity scores can be plotted against surface temperatures in a scattergraph and a line of best fit can be added to the plots to show the relationship between reflectivity and actual temperatures. Similar plots can be made to show if there is any correlation between the shortest distance to a vertical structure and air temperature.
Air temperature and wind speed data can also be sited on a map. Isoline maps can be drawn for each with data being interpolated to areas in between and beyond the surveyed points on the school site. Students will have to carefully consider the value of each isoline so that the data is both easy to read and at the same time informative.
Finally students need to address the data which shows how vertical structure height affects wind speed. For this, data taken in an open space (such as a school playing field with no obstructions to wind flow) show be taken as the baseline data. For each survey point around the school buildings it needs to be noted whether the wind speed was higher or lower than the baseline reading. This data can then be plotted against vertical structure height to show if the wind is funnelled alongside tall buildings or if the wind is blocked by it (below).

Data Analysis
Students need to look for relationships between the different sets of data that they are handling in this fieldwork. The scattergraph plots can be analysed using a line of best fit and students can comment not only on the strength of any particular relationship (how closely plot point sit on the line of best fit) but the relative strength of different relationships when data sets are compared with each other (such as a commentary on whether surface texture or colour appear to have the greater influence on surface temperatures).
Similarly a line of best fit can be applied to the wind speed variance and building height graph, though students should be aware that this is likely to be a curvilinear line of best fit rather than a straight line. Secondary data on wind speed and building height in other locations can be used and students can discuss to what extent their school site represents a typical picture of wind speed variance.
The map of reflectivity of the school buildings and ground surfaces should be compared with the isoline map of the air temperature to see if there is a particular part of the school site that absorbs or reflects heat more or less than another. This location can be scrutinised in more detail to find what it is about that area that makes this so.
Students should look for areas of the school site that represent the ‘perfect storm’ of variables that would make the location extremely cool, warm, windy or still and see if these exist (and how the real data corresponds in these locations).
- Fieldwork

Microclimate
Microclimate data can be collected in any location, including the school grounds
- Fieldwork
Weather experiments
A selection of ideas for creating your own weather instruments in the classroom or at home
- Fieldwork
Weather and climate fieldwork ideas
Ideas for weather and climate fieldwork