How do different stakeholders feel about the way a local habitat should be managed?
Gauging the attitudes of stakeholders is an activity that can easily be taught through fieldwork. Though in this example the views are related to habitat management, a similar exercise can be applied to stakeholder views on river management schemes or coastal defences. Through this activity students can develop their understanding of different habitat management strategies as well as create a data-rich set of results which lends itself to a wide variety of analysis techniques.
Specification links
Edexcel A: 3.7 Different approaches to the sustainable use and management of deciduous woodlands in a named region.
Eduqas A: 8.2.1 Strategies to restore habitats that have been damaged by human activity.
Eduqas B: 3.1.3 The challenges of managing the ecosystem and how different stakeholders perceive its value.
Data Collection
Location: Local nature reserve / Country park; Urban park (within which is a wilderness area or similar); Local woodland
Time required: Half day
Equipment list: Clipboard; Data collection sheets. (Some students may benefit from the use of a voice recorder app on a device)
Pre-trip preparation:
Introduce students to the concept of stratified sampling and work through examples using M&Ms or similar. Students should also start to think about the different users of the field site and their motives for using the area. Students should be able to describe the different habitat management strategies that could be (or are being) deployed in the park. Students might like to create hypotheses about who the most common users will be and what management strategies they would most likely favour.
Tasks and activities
In the park, students should carry out a user survey. Standing in a busy area, and over a set period of time, students can note down how different people are using the park and create a tally list of the number of people who fall into each category they create. For example, students may create categories such as
-
Dog walkers
-
People taking exercise
-
Wildlife enthusiasts
-
Commuters passing through
-
People resting / sunbathing
-
Parents playing with children
It might also be possible for students to identify other characteristics of the park users such as their approximate age or their gender. Students should then calculate what percentage each group represents of the whole and use these figures to create a stratified sampling strategy for the subsequent questionnaire. This would make sure that the questionnaire respondents were representative of the numbers of different users of the park.
The questionnaire would be made up of two key questions. Firstly, students should ask users to rank a number of habitat management strategies (five is a sensible number to use) in order of their preference. These management strategies must suit the type of park the students are using as a field site. For a typical grassland park these might include:
-
Fencing off damaged areas
-
Wildflower seeding and tree planting
-
‘No mow’ policies in summer
-
More regular litter clearance / littering and fly tipping patrols
-
Bans on certain activities such as barbeques
-
Removal of non-native trees and shrubs
-
Installation of bird nesting and bat roosting boxes
The second question would ask users to name an aspect of the park that they particularly value. This open-ended question would reveal to students how different users prioritise different aspects of the park, and subsequently, whether the natural habitat the park represents is of ‘value’ to users at all.
Students may like to add in additional questions to their questionnaire to add further details about user’s perceptions if they wish.
Data Presentation
Each of the two questions in the questionnaire lends itself to a different form of data presentation.
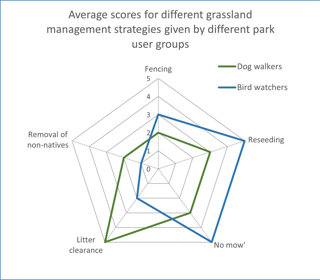
The habitat management ranking exercise can be presented as a radial graph (below). Each axis of the graph represents a different habitat management strategy. The rankings given to each strategy should be converted into scores. For example, a strategy that was ranked first (i.e. most favourable) should be given a score of five out of five, the strategy that was ranked second should be given a score of four our of five etc. This means that a single user can be plotted on the radial graph, with the scores for each strategy extending out along each of the axes. Each type of user could be allocated a different colour line so that the average score given by different user groups could be compared. In the example just two user groups have been added but students could continue to add lines of different colours to represent the different user groups.
The open ended second question regarding aspects of the park that users most value will generate a lot of different answers that might best be represented through word clouds. Students could create a word cloud for the entire sample or, depending on the size of the total sample, a word cloud that represents the favoured aspects of the park for each group of users.
In addition to data presentation that relates to each of the questions, students might also wish to design a profile of a typical user of the park. This could be a list of characteristics with which a typical user would comply. Alternatively, a more creative approach could see students given an outline of a human form onto which they have to draw a typical user along with annotations that explain their choice of design.
Data Analysis
From the radial graph, students will be able to identify areas of consensus between different park users and areas of disagreement. Students might like to use this information to draw a conflict matrix showing how different users (or stakeholders) feel about different habitat management strategies. This may reveal that some management strategies are areas of extreme conflict with some user groups favouring them highly, with others loathing them.
Word clouds automatically present the most popular words and phrases in the largest print, which makes them easy presentations of data to analyse. Students can again use these to find areas of consensus in the aspects of the park that users most value.
From these observations, students should look to do two things. Firstly, students can find out if the most popular habitat management plans protect the very things that people value most in the park, or if compromises would have to be made to satisfy the needs of the users with the needs of the natural habitat. From this, students may be able to design a habitat management plan for the area which takes into account the needs and desires of the different stakeholders who use the space.
- Fieldwork

Investigating opinions
Interview surveys and questionnaires
- Fieldwork

Human impact studies
Environmental impact assessments, pollution studies and more
- Fieldwork
Sampling techniques
Data is gathered on a small part of the whole parent population or sampling frame, and used to inform what the whole picture is like