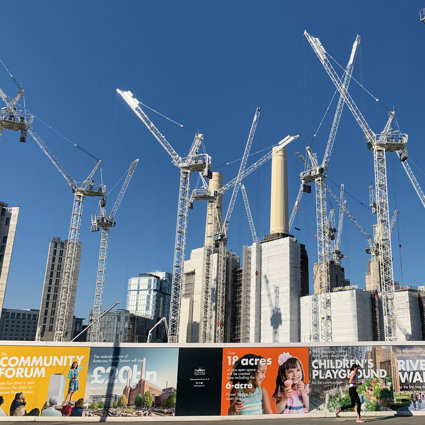
To what extent is there a need for regeneration in an urban area?
As a popular fieldwork topic, the regeneration of urban areas gives students not only a wide range of data collection techniques to use, but also feeds lots of ideas into discussions about why regeneration maybe needed, the different forms of regeneration and for whom regeneration might benefit most.
Fieldwork based around regeneration often takes one of two angles: firstly, retrospective studies into the impact, both positive and negative, that regeneration has had on an area, and secondly, an assessment of the need for regeneration in an area which has previously been in decline. Though the focus of this study will be the latter of these two fieldwork experiences, some of the techniques mentioned will inevitably be transferable to the former.
Specification links
AQA 3.2.1 An example of an urban regeneration project to show: • reasons why the area needed regeneration • the main features of the project.
Edexcel A 4.5 The range of possible strategies aimed at making urban living more sustainable and improving quality of life (recycling, employment, education, health, transport, affordable and energy-efficient housing) for the chosen UK city.
Edexcel B 5.6 How regeneration and rebranding of the city has positive and negative impacts on people (increased population, environmental quality and economic opportunities).
OCR B 5.2 Investigate the contemporary challenges that affect life in [the] AC city, such as housing availability, transport provision, access to services and inequality.
Data Collection
Location: An urban place with a variety of sub-areas that could be deemed to need an element of regeneration.
Time required: Full day
Equipment list: Data collection sheets; Clipboards
Pre-trip preparation:
Students should develop a firm understanding of the urban area in question and especially issues around economic and social decline and why the area might have suffered in recent times. Analysis of old newspaper articles will allow students to see how the town or city has changed, and compare the current lived experience of that of yesteryear. In the same way, students are likely to also benefit from viewing older maps and photos of the town or city. Students will be undertaking a form of systematic sampling and it is always useful to introduce this terminology and the workings of the concept to them before they experience it in the field.
Students might also wish to devise the factors being measured in their Environmental Quality Survey, and think about how they and others might value a space in different ways. Similarly, students should begin to think about how ‘bad’ a place might have to be in an Environmental Quality Survey for it to merit a genuine need for regeneration. As such, broad ‘requisite criteria’ might need to be established prior to the fieldwork so that students can more objectively critique the town or city.
Tasks and activities
In this field work, students will establish regeneration need through three broad themes: economic regeneration (through a survey of local employment structure), social regeneration (through a survey of ease of access around the area) and environmental regeneration (through a survey of visual attractiveness).
Students should attempt to conduct a short questionnaire interview on local business owners and managers. For this it is best to split up the main commercial and industrial areas of the town between groups of students so that no business is targeted twice by students. The format of the questions could cover
-
The number of employees
-
The number or percentage of workers on the national minimum wage
-
The number or percentage of workers who are working part time
-
The number or percentage of workers on seasonal or temporary contracts
-
The estimated salary difference between the highest and lowest earning employees
This data will help students to establish the degree to which there is a healthy and sustainable local employment structure.
An accessibility survey of the urban area asks students to note down on a base map any features which either aid increased accessibility for users of the town (such as tactile paving, handrails and ramps) or hinder it (such as long flights of steps, blind corners and narrow pavements). A green and red colour code could be used to show those features that aid or hinder access respectively. Again, if a large area needs to be covered, the town could be split up between working groups.
Finally, students should carry out an Environmental Quality Survey to find out which areas score highly and poorly in visual attractiveness. This can be done through a systematic sampling strategy. Over the top of a map of the town, students should place a grid, dividing the town into equal sized squares. The grid should aim to create around one hundred squares or more if the number of students and the size of the town allows it. Students should carry out an Environmental Quality Survey in each of the squares from a point as close to the centre of the square as possible. Factors students might like to include in an Environmental Quality Survey would be
-
Amount of greenery
-
Amount of litter
-
Amount of noise
-
Attractiveness of street furniture
The Environmental Quality Survey should also work on a one to five numbered scale with one representing the unattractive and five representing the attractive.
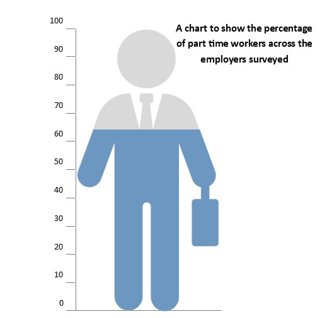
The data yielded from the employers survey is hugely flexible in terms of being relatable to different forms of data presentation. As a lot of the data is likely to be percentages, it makes sense for students to create a series of percentage bars or pie charts to show relative numbers of part time workers, temporary workers or workers earning the national minimum wage. Alternatively, students might like to choose a shape, such as a typical worker (below), or a shop, and shade the shape appropriately to show the percentage.
The access ability survey as part of the data collection process, will already be sited on a map. To present the data further, students could demark areas of the map that are access ability ‘hotspots’ (where numerous types of access are problematic) and accessibility ‘highways’ (where everyone would have the freedom to access all spaces equally).
The grid system used to select data collection sites for the Environmental Quality Survey can also be used in the data presentation phase. With each square in the grid system given a total environmental quality score, a five tier choropleth shading system can be designed - with the darkest shade representing the highest scoring squares in the grid and the lightest shade representing the lowest scoring. The values attributed to each tier depend on the range of total scores recorded and students can experiment with different tier values to see how interpretation of the map might change.
Data Analysis
From the start of the data analysis section, students should recognise the need to analyse data in each of the three themes (economic, social and environmental) as well as collectively in order to find the extent to which regeneration in the town is needed more generally. Results from the employers survey can show a profile of an average employee in the town. Though part time and temporary contracts are not necessarily a bad thing, students should recognise that they can represent a less stable employment structure for a household that relies upon that type of work. Therefore in general, students need to draw their own conclusions given the history and context of the town. They should think about whether these forms of work are sustainable or whether local economic reform and regeneration is needed (such as opportunities to work in more stable, higher paying industries).
Analysis of the accessibility map can take a more practical angle. Students can use the map to work out the maximum distance someone can travel from the centre of town to the outskirts, unhindered by accessibility issues. Students can then judge whether this distance is acceptable and whether regeneration in the town could improve social accessibility for everyone.
The choropleth map generated from the Environmental Quality scores should allow students to see areas of the town that generally score well and areas that may be in need of regeneration that improves the natural and built environment. Students should be encouraged to identify spatial patterns in the map, for example if the commercial centre of the town scores very differently from the inner suburbs.
Students should then aim to find consensus between the three themes of data. There may be areas of the town that have both poor social accessibility and poor environmental attractiveness, making these areas appear in greater need of regeneration than others. There may be parts of the town that also have unstable employment prospects for local people, but which are also in environmental decline, again signaling the need for regeneration and possible new, environmentally sustainable developments.
- Fieldwork

London 2012 Olympic Park
Written before the London 2012 Olympics, this resource looks at the developments in East London in the lead up to the Games
- Fieldwork

Urban studies
Ideas for urban fieldwork
- Fieldwork

Quality of life
Investigating variations in quality of life between different localities