What are the main challenges facing rural areas?
Carrying out fieldwork in a truly rural and wild area is actually quite difficult. Areas with few amenities, features and activities leave the geography student with a limited amount of variables to measure in any meaningful way. Rural areas on the immediate periphery of urban centres (such as commuter villages) or, as in this example, rural areas with an element of tourism in their economy make for much better field work sites.
The challenges explored in this field work are not necessarily unique to rural areas, but students should be aware that whilst their impact may be felt as an inconvenience in urban centres, in rural areas the impacts can be much more acute and more widely felt. Therefore, when studying the challenges that face rural communities students should be mindful of who these communities consist of and how closely their lives may be linked to the environment around them.
Specification links
AQA 3.2.1 The impact of urban sprawl on the rural–urban fringe, and the growth of commuter settlements.
Edexcel B 5.8 The challenges of availability and affordability of housing, decline in primary employment, provision of healthcare and education and how they affect quality of life (IMD) for some rural groups (elderly and young people).
Eduqas A 1.1.2 The environmental challenges created by human activity in one distinctive landscape to include the positive and negative impacts of visitor pressure and changing rural economies and societies. The concepts of honey pot sites and carrying capacity.
Eduqas A 2.1.2 Impacts of urban spheres of influence and technological change on service provision in rural areas (for example, the closure of village post offices and banks). Causes and effects of rural poverty and deprivation and the process of depopulation of remote rural areas. Strategies for creating sustainable rural communities.
Eduqas B 1.2.1 The impact of change on rural areas of the UK to include villages which have become commuter settlements.
Eduqas B 1.2.5 How urban and rural areas are used for leisure. Advantages and disadvantages of leisure use for both local residents and leisure users. The impacts of increasing leisure use on rural honeypots. Positive and negative impacts of major sporting events on localities.
Data Collection
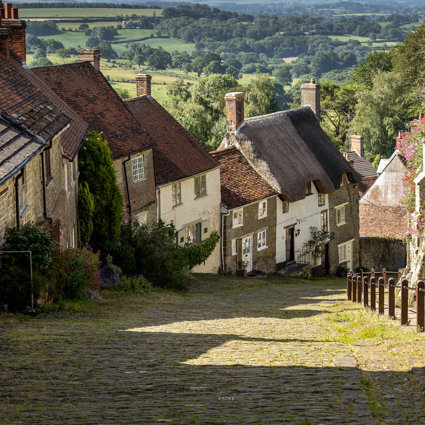
Location: A rural area which attracts tourists.
Time required: Full day
Equipment list: Data collection sheets; Clipboard; SoundMeter App downloaded onto a smart device OR a Decibel counter
Pre-trip preparation:
It is often a surprise to students to learn that rural areas can be places of great poverty as well as wealth and a study of data associated with this (such as through Indices of Deprivation 2015 and 2019 (communities.gov.uk)) can help them to understand what the lived experience may be like for people in the study area. Alongside this students can conduct an online image search of the area to find out what visually summarises the location for wider audiences and how the area may be perceived by outsiders.
Students can also plan a two day trip to the area for a typical and hypothetical family of four. They can use internet based research to find activities, accommodation and hospitality venues to cater for their family and in doing so gain a better understanding of what may draw people to the area.
Tasks and activities
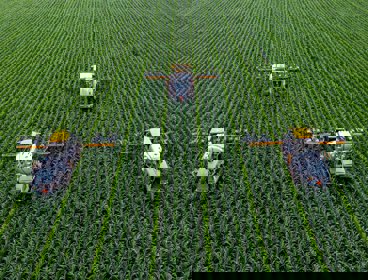
Students should start their investigation in the area which one might deem the ‘hub’ of tourism in the rural area. Here, in different locations, separate groups of students should conduct a number of surveys to gauge if there are any issues around environmental stewardship. A litter count (in terms of size, quantity and type of litter) is a useful starting point. This can quickly be followed by a noise survey using a hand held decibel counter or an app such as Soundmeter downloaded onto a smart device. The average decibel reading over a period of three minutes can be recorded with students being careful not to distort the data by talking during the recording.
At regular intervals moving away from the tourism hub along individual group transects, these two surveys should be repeated. In the execution of their litter survey students should think carefully here about the size of their sample area and ensure there is consistency as they move along their transect. A roughly five by five metre square can be paced out in each location with no need for equipment. Students equally may prefer to tally any piece of litter they can see in a 360 degree visual sweep from their chosen location. At each location along their transect, students can also measure how busy the place is by conducting a traffic and / or a pedestrian count.
As students move along their allocated transect they should note any issues they observe regarding the negative impacts of tourists. Where possible, a photo journal should be kept, with students recording their observations on a smart device from which the images can be later downloaded. Observations that students might make include
-
Traffic congestion
-
Overcrowded narrow pavements
-
Inconsiderate or illegal parking
-
Eroded footpaths
-
Overflowing litter bins
-
Trespassing
Finally, students should note any place of employment they come across while walking their transact, and in doing so record in which sector (primary, secondary or tertiary) employees are most likely to fall and whether the place of employment relies partially (such as a supermarket), wholly (such as a hotel) or not in the least (such as a school) on tourism.
Data Presentation
Litter, noise and pedestrian and traffic tallies can very easily be plotted against distance from the tourism hub, and possibly on the same x axis by creating a dual y axis graph (below).
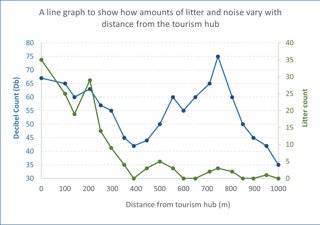
The results from the decibel count for each group can be collated together to produce an area wide map. From this it may be possible for students to draw on isolines joining places of these same noise level.
Students can use their photo journal of the negative impacts of tourism to create a photo map annotated with descriptions of what was observed at different locations. To build another layer of complexity into this data presentation technique, students might like to give each observation a score from one to five with one being a minor inconvenience and a score of five having a truly dramatic or long lasting impact.
The data yielded from the survey of employees can be displayed as a percentage bar or a pie chart, or for a different approach, students could work out the number of employees in each sector as a percentage of the total and draw a triangular graph to show the position of each transect covered by the cohort.
Data Analysis
Using a combination of the decibel map and the litter and pedestrian or traffic graphs, students can easily say whether it is the case that all those factors decrease as one moves away from the tourism hub. Students should aim to combine qualitative evidence from their photo journal map with quantitative data from their graphs in order to create well-rounded conclusions. Students who are maths confident may also wish to carry out a Spearman's Rank Correlation Coefficient test between distance (from the tourism hub) and any of the variables to see if there is a statistical relationship between them.
Students should look carefully at their employee data to decide whether it represents a sustainable employment structure or one that relies overwhelmingly on tourism, which by its nature is likely to produce seasonal employment.
With the data collection phase amassing a large variety of data, students should be encouraged to draw on all the available evidence to suggest which of the variables measured creates the biggest challenge for local people and which are of lesser concern. It may be useful for students to think about the challenges in terms of a spectrum, an exercise that can create useful opportunities to discuss wider points such as whether challenges are felt equally by all members of the rural community or whether challenges are different at different times of the year.
- Fieldwork

Tourism and recreation
Investigating the impact of tourism and recreation
- Fieldwork
Rural investigations
There is huge scope for investigating the land-use, function and issues in rural areas, and their changing identity and character
- Fieldwork

Human impact studies
Environmental impact assessments, pollution studies and more