What are the social and environmental impacts of different coastal management schemes?
Evaluating the effectiveness of different coastal defences is a common requirement at GCSE. Through fieldwork techniques which critique such defences, students not only develop a greater understanding of the defences themselves, they learn evaluative skills that they can apply to many other areas of the curriculum. With a focus on social and environmental impacts, many elements of the data collection, presentation and analysis below can easily be adapted to suit a similar evaluation of flood defences in the river topic.
Specification links
AQA 3.1.3.2 The costs and benefits of the following management strategies: • hard engineering – sea walls, rock armour, gabions and groynes • soft engineering – beach nourishment and reprofiling, dune regeneration • managed retreat – coastal realignment.
3.1.3.2 An example of a coastal management scheme in the UK to show: • the reasons for management • the management strategy • the resulting effects and conflicts.
Edexcel A 1.4 The advantages and disadvantages of different coastal defences used on the coastline of the UK (hard engineering, sea walls, groynes and rip rap and soft engineering, beach nourishment and managed retreat) and how they can lead to change in coastal landscapes.
Edexcel B 4.5 Why there are costs and benefits to, and conflicting views about, managing coastal processes by hard engineering (groynes and sea walls) and by soft engineering (beach replenishment, slope stabilisation) as well as more sustainable approaches (‘do nothing’ and ‘strategic realignment’ linked to Integrated Coastal Zone Management).
Eduqas A 4.2.1 How ‘hard’ and ‘soft’ engineering strategies may be used to reduce the risk of erosion and flooding at the local scale. Contrasting opinions about ‘hold the line’ and ‘managed retreat’ options in relation to one low lying coastline at risk of sea level rise (for example, North Norfolk or Essex)
Eduqas B 2.1.2 Contemporary management options to reduce risk of coastal floods/erosion. Coverage must include: · costs/benefits of hard engineering options such as sea walls, groynes, gabions and rock armour · costs/benefits of soft engineering options to include beach nourishment, beach stabilisation and wetland creation · concepts of ‘hold the line’ and ‘retreat the line’.
Data Collection
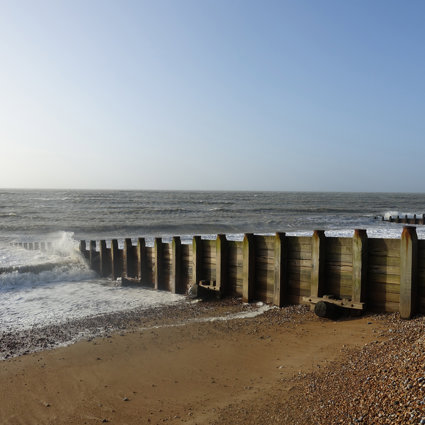
Location: A section of coastline with at least one coastal management strategy in place.
Time required: Full day
Equipment list: Data collection sheets; Clipboard; Rope or string; Buckets; Pebbles colour coded with nail varnish
Pre-trip preparation:
Though not essential, it is useful for students to have a broad understanding of how different coastal defences work and to have seen images or videos of them working in situ. If the field site has a variety of defences this can be done in the field itself with students observing the defences in action.
Students should also have some background knowledge of key factors that define and identify the field site. Researching the area that holds the coastal defence in terms of its resident demography (through Census 2021) and its position in the national picture of deprivation (through Indices of Deprivation 2015 and 2019 (communities.gov.uk)) will provide students with background knowledge that will help them piece together why certain coastal defences may be seen as more or less socially effective then others. Students might also wish to see if any area of the defended coastline falls under a protected status (such as an AONB or a SSSI) through a site such as Magic Map Application (defra.gov.uk).
Tasks and activities
If there is a safe and clear vantage point of a coastal defence (for example from the shoreline) it is a good idea to start the fieldwork activities with time to observe the defence in action. Using a smart device, students can produce a thirty second video of the coastal defence with themselves providing a voice over, explaining how the management technique is defending the coastline.
Students can then carry out a Coastal Management Effectiveness Survey (CMES). Similar in design to an Environmental Quality Survey, the CMES uses a bipolar or weighted score against a number of variables which students can observe. These might include
- Whether the coastal defence enhances or worsens the look of the coastline
- Whether the coastal defence allows for habitat creation / destruction for wildlife
- Whether the coastal defence improves or removes access to the beach
as well as other criteria that students feel are important given their pre trip research of the local area.
Students can survey different parts of a single coastal defence or different coastal defences (including areas of no defence) if the field site has them. This activity could be done individually or in groups with average scores being calculated later.
An engaging data collection technique that is both memorable to students and likely to yield high numbers of respondents at a field site is an oversized ‘living Likert’ scale. Using a large length of rope laid out in a public place, members of the public are asked to place a marker (such as a pebble) in a bucket at a point along the rope that best represents their level of agreement or disagreement about a statement, with one end of the rope representing strong agreement and the other strong disagreement (below).
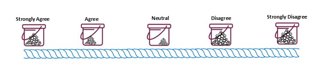
Different colour pebbles can be used to show the opinions relating to different statements such as
-
“The sea wall detracts from the natural beauty of the beach”
-
“Protecting the coastline from eroding away is more important than how the coastline looks”
Students should aim to write eight to ten statements in advance of the field trip and have these laminated on cards for members of the public to read. This will allow students to have enough data to analyse when they return to the classroom.
Though the exercise can as easily be carried out in the form of a paper based questionnaire, a public display can attract people to take part whom otherwise might avoid one to one interviews. Care should be taken to ensure that the data collection equipment does not interfere with peoples’ access to an area or cause a trip hazard.
Data Presentation
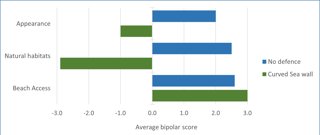
From the Coastal Management Effectiveness Survey (CMES) students may wish to draw a bi polar bar chart (below). Using the scores given in each of the categories in the CMES, students can then allocate colours to each of the coastal defences surveyed, allowing them to compare the scores given on one set of axes.
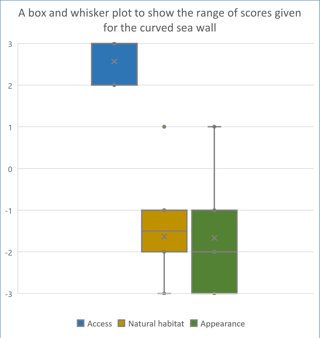
If it is possible to collate data together for a whole class, students might like to calculate the interquartile range of scores given against each criterion (see data analysis section) and draw a box and whisker plot, highlighting the maximum, minimum, median score as well as the range of scores given (below).
Data from the ‘living Likert’ scale can be presented in a number of simple ways, students might like to draw a multiple column chart with a different coloured bar in each set of columns representing a different level of agreement (strongly agree; agree; neutral; disagree; strongly disagree). Likewise, for each statement, the number of pebbles that were placed in each bucket could be converted into a percentage and a percentage bar drawn for each.
Data Analysis
Where group data from the CMES can be collated together, students may gain a lot from studying the interquartile range of the scores from one or more of the criteria used. This shows the extent to which the cohort of students viewed the coastal defence in the same way and the spread of opinion found within that sample of data. The link below walks students through the method of finding the median score given to a particular CMES criteria as well as the placement of the lower and upper quartiles in that range. A small interquartile range shows that there was a high degree of consensus between students about that criteria, while a larger interquartile range indicates a more varied range of opinions.
The ’living Likert’ scale again produces data that falls in two different categories (strongly agree; agree; neutral; disagree; strongly disagree). Students can analyse which of the five categories received the most number of votes for each statement used, as well as which category received the fewest. Students can see what (if any) consensus there is between the most favoured statements and start to build a picture of what kind of viewpoints are the most popular among the members of the public who live and work locally to that coastal management scheme. Students can also analyse the data to find for which statement respondents were most divided (where the majority of answers were strongly agree and strongly disagree) and for which statement respondents were most apathetic (where the majority of answers were neutral).
- Fieldwork

A student guide to the A Level independent investigation (Non-examined Assessment - NEA)
Download a copy of our guide
- Fieldwork
Coastal processes and management
Ideas for coastal processes
- Fieldwork

Jurassic Coast of Dorset and East Devon
The Jurassic Coast of Dorset and East Devon is a 95 mile stretch of coastline that demonstrates 185 million years of geological history