What factors influence land use in an urban area?
Land use surveys are a common data collection technique in geography fieldwork and are often used to create wider contextual information about a place. Less often do land use surveys perform a more central role in which they determine zonation in an urban space, such as they do in the following investigation.
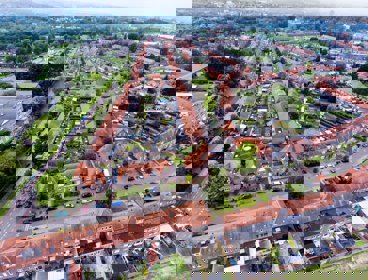
It is also not so common to undertake assessment of the physical landscape in an urban space. Great care should be taken to ensure such surveys do not impede or endanger pedestrians and careful planning may be needed to ensure the most efficient use of time and equipment in the field, especially as a large area of the town may need to be covered.
Specification links
AQA 3.2.1 The impact of urban sprawl on the rural–urban fringe, and the growth of commuter settlements.
Edexcel A 4.3 Chosen UK city’s structure (Central Business District (CBD), inner city, suburbs, urban-rural fringe) in terms of its functions and building age.
Edexcel B 3.3 Characteristics of different urban land uses (commercial, industrial, residential) and the factors that influence land-use type (accessibility, availability, cost, planning regulations).
Edexcel B 5.3 The city’s structure (Central Business District (CBD), inner city, suburbs, urban-rural fringe), in terms of its functions and variations in building age and density, land-use and environmental quality.
Eduqas B 1.2.2 How the processes of urban change over time have created distinctive spatial zones/patterns in UK towns and cities. The characteristics of town/city centres to include Central Business Districts (CBDs) and pedestrianised zones. The distinctive features of UK towns/cities to include zones of affluence, zones of deprivation, zones undergoing rapid regeneration, zones where multi-cultural communities thrive and multi-purpose zones where people live, work and enjoy leisure and cultural opportunities.
Data Collection
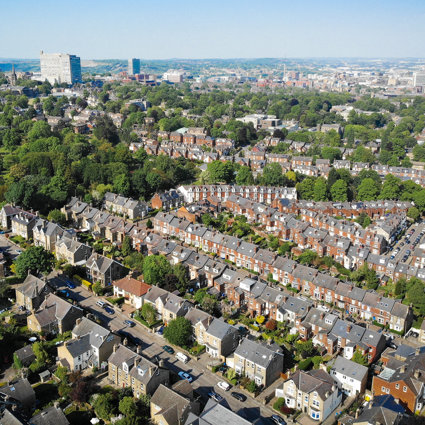
Location: An established town or city which has relatively distinctive zones.
Time required: Half day
Equipment list: Data collection sheets; Clipboards; OS Map
Pre-trip preparation:
With geographical concepts reflected from key stage three settlement topics, it may be worth revisiting with students exercises such as the popular ‘siting a settlement’, which encourages students to think about physical features of a landscape that satisfy early human needs for survival.
Students should also study OS maps of the town and use these to identify landscape features. It may be a useful exercise, if possible, to compare current OS maps with much older maps to see the growth of the town and how roads and spaces within its perimeter have changed over time.
As students will be spending a lot of their time in the field identifying land use from buildings it may also be beneficial to go through all of the building types they can think of and to identify which land use category they may fall into. They can also discuss how they will deal with buildings that appear to have two land uses such as ground floor shops that house residential apartments on their upper floors.
Tasks and activities
The town should be split into roughly equal sized sections and students should begin by completing a land use survey of one section per group. Going from building to building students should decide into which category each building or area of land falls. Land use categories should follow those used conventionally in wider geographical research:
-
Residential
-
Commercial
-
Industrial
-
Leisure and recreation
-
Agricultural
-
Transport
-
Municipal
-
Open space
-
Derelict or abandoned
At the same time, students can estimate the age of the building (in age categories) and its value. Building value can be estimated using a proxy indicator such as building height (the number of storeys) or the number of windows on the frontage. Students should be encouraged to critique these methods carefully. Building age and value can give students a greater insight into how the town has been developed overtime and where the most valuable areas are.
All three elements of data could be done through the use of GIS to allow students to more easily collate their information together and create a comprehensive map of the town. If there is time and means, students should also record on their base map the aspect of each building (i.e. which way their front door or main entrance faces). This is to allow students to see if there is any correlation between land use and aspect as certain areas, such as housing estates, maybe built with the position of the sun in mind.
Students should also spend time creating a secondary data portfolio of the town. This should include data on the prevailing wind direction, how often it blows in that direction and its average strength. This is to compare the land use either side of an area which traditionally would have been polluting or environmentally unpleasant. Students should also look at the contour lines on an OS map to show the altitude of the land in each land use section they are surveying. Altitude can tell students a lot about how different parcels of land may have been built on at different times for different purposes: higher land may have had a defensive advantage while low lying land is likely to be better fed by natural water resources. Finally, a desk study into soil and subsurface geology for the town can be mapped, with the students paying particular attention to the relative permeability of the different areas of the town that have been built on.
Data Presentation
The land use map created during the data collection phase can be redesigned to show polygon blocked ‘zones’ of different land uses rather than each individual building. GIS packages such as Digimap and ArcGIS can easily produce these digitally, while at the same time allowing for layers of additional data such as building age and value to be placed over the top. Equally, students can continue to use their data collection sections to present data, with proportional shapes appearing in each section of the map according to the average building age or value score. In addition, arrows can be used to show the most common building aspect direction.
If exact figures were known for building age and value the variables measured would be plotted against each other in a scatter graph. However, almost always, the data is collected in categories and not actual figures. A dot plot (right) can be used instead to see if there is a relationship between building age and value, age and altitude, or altitude and value.
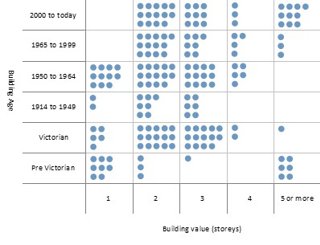
More secondary data sought using an OS map could provide additional data for dot plots. Students could plot the building variables (age and value) against distance from a settlement nucleus such as a port or a train station. Though these correlations may not be directly linked to land use, they do serve as indicators of zonation and allow students to discuss why certain features of a town appear in certain places.
Depending on the nature of the data spread and the size of the town it may be possible to create a choropleth map to show building age and/or building value, using the categories of data already used in the data collection phase.
Data Analysis
With the data collection phase yielding a wealth of data, it is important for students to focus on the idea of land use zones and not to get overwhelmed by other geographical factors at play in the investigation. Students should begin by looking at the main land use zones (residential, commercial, industrial etc) and seeing what commonality there is with other variables such as building age, value and aspect. Students can comment on the strength of that relationship and identify any buildings that sit outside the ‘normal’ pattern of land use, age, value or aspect. Students may wish to use this information to compare their fieldwork location with theoretical urban morphology models such as Burgess, Hoyt and Harris and Ullman, as well as use zone names for each of the differentiated areas they have identified from their land use map.
Students should then think about why certain land use zones appear where they do. Analysis of land altitude data and building type will inform students of how certain land uses appear in certain physical conditions and which zones appear downwind of each other when consideration is given to the prevailing wind and the conditions of that wind (whether it is generally warm or cooler and whether it is wetter or drier). Further comparisons may be made between subsurface geology, land use and building age. It is likely that geological factors would have been a significant deciding factor in where older buildings were placed while newer buildings benefit from advanced technology and building design which may overcome what were once geological barriers.