What impact might international migration have on an urban area?
International migration has driven changes to UK towns and cities over multiple generations. These changes have ranged from how politically populations have aligned, to how people eat, dress and speak. Many UK towns and cities have evolved a range of identity's associated with different groups of migrants and fieldwork is a great way for students to explore these identity's from a new perspective. It also allows students insights into cultures that may be very different from their own and with whom students may not have had any meaningful interaction, despite them calling the same urban space home.
Specification links
AQA 3.2.1 A case study of a major city in the UK to illustrate the impacts of national and international migration on the growth and character of the city.
Edexcel A 4.4 Causes of national and international migration and the impact on different parts of the chosen UK city (age structure, ethnicity, housing, services).
Edexcel B 5.4 Causes of national and international migration that influence growth and character the different parts of the city (age structure, ethnicity, housing, services, culture).
Eduqas B 1.2.3 How migration, from outside the UK, has social and economic consequences for urban and rural areas of the UK.
OCR A 1.2.6 Case study of one major city in the UK including the influences of migration (national and international) and its impact on the city’s growth and character.
OCR B 5.2 Patterns of national and international migration and how this is changing the growth and character of the city.
Data Collection
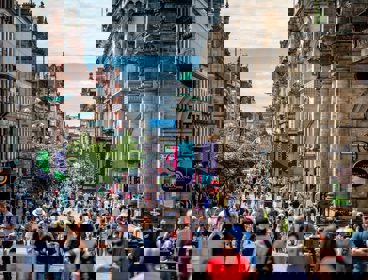
Location: An urban space with a recent history of being a home to international migrants.
Time required: Full day
Equipment list: Data collection sheets; Clipboard; Digital audio recorder
Pre-trip preparation:
Even if the urban field site in question is well known to the students, it is still a worthwhile exercise to analyse census data (through Census 2021) and deprivation indices maps (through Indices of Deprivation 2015 and 2019 (communities.gov.uk)) for the town or city. This sets the baseline knowledge with students about what the town or city is like. It may also be helpful to identify areas of the urban area where there appears to be residential clustering of certain ethnic groups or people from particular countries of origin.
It is worth exploring the migration history of the urban area. A guest speaker who sees themselves as an international migrant may be willing to come into the classroom to talk about their migration story first hand. It is also a good idea to address with students the need for geographical research of this nature to be both objective and respectful, and how they themselves can be advocates for open and considerate discussions within what is often a divisive topic.
Tasks and activities
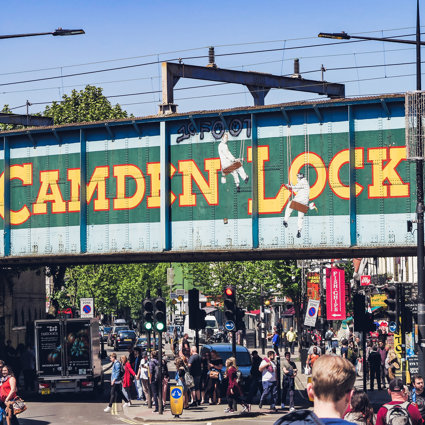
Students might wish to carry out a survey that plots features of different international cultures on a map. These surveys could take place along transects that all start from different points in the main commercial area of the town or city and radiate out to different residential areas. Such features might include
-
Shops with aisles selling international foods
-
Signs and posters written in languages other than English
-
The placement of flags (real or images of) on buildings
-
Shops selling clothing associated with particular cultures and heritages
-
Places of worship and cultural centres
Students might also be able to carry out a face to face interview with a local councillor which would focus on the opportunities and challenges created by international migration in the town or city in recent times. It is a good idea to ask permission to digitally record this interview so that students can listen back to it numerous times. Students can prepare questions in advance of the interview based on the background research they will have done prior to the field trip.
From the interview students should be able to identify the top three opportunities created by international migration and the most pressing challenges as seen by the counsellor. Armed with this information students can carry out a questionnaire survey on members of the public to see if they agree with these. Questions could be
-
“What do you consider to be the most positive consequence to come about as a result of [Town X]’s history of international migration?”
-
“What do you consider to be the most important challenge to come about as a result of [Town X]’s history of international migration?”
A further dynamic to this questionnaire would be to carry it out in two different areas of the urban place: one area where census data shows there to be an extremely diverse community whose heritage stems from different countries, and another that is more homogeneous.
The mapped survey of different features that evidence international migration is itself a form of data presentation, but once back in the classroom students may wish to categorise each feature even further. Students could colour code each feature by type (for example flags, signs, retail outlets etc) or by the global area of origin (for example European, Asian, Arabian etc). If the scale of the map allows, students could digitally place miniature flags onto the map to indicate which countries were represented by the different features that were observed. Students might also use a blank global chart to create a desire line map. Lines are drawn from the fieldwork site to the country represented by the features observed in the field.
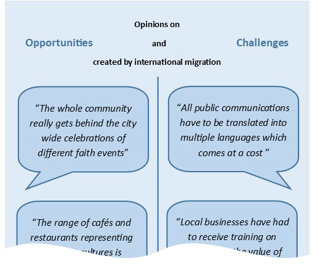
The qualitative data generated by the councillor interview can be transcribed. A quote bank (below) can be created with speech bubbles either side of a dividing line, with one side representing the opportunities international migration has created in the town or city and the other side representing the challenges it has created.
If enough members of the public are able to answer the follow up on the street questionnaire, the resulting data can be presented as a proportional shaped chart. With distinction made again between opportunities and challenges (such as by colour or symbol) the size of the shape can be adjusted to represent the number of people who gave that answer.
Data Analysis
The map of international migration evidence can be analysed through clustering tools such as the Nearest Neighbour analysis (see link below). This would allow students to statistically show whether certain areas of the urban place display a defined cluster of features of international migration compared to others. Students might prefer to do this by eye and identify areas of the town or city where international migration has clearly had an impact on the local economy and streetscape. A deeper analysis of the countries referenced by these features may reveal an emphasis on a particular world region or something that links otherwise unrelated countries together such as colonialism or sharing a language base. Students will be able to recognise the degree to which there is a pattern in the countries represented.
The transcript of an interview with a local councillor may be further analysed through coding (see link below) which can turn the qualitative data into quantitative data. This in turn can be used to compare different contexts within the interview more easily and allow students to quantify the strength of feeling around certain topics.
Comparing the key opportunities and challenges highlighted by the councillor with those spoken of by members of the public may reveal some interesting areas of contrast or consensus. Students might be able to hypothesise why a local councillor may have a very different view of the impact of international migration to that of people who live and work in the same community.