
What is climate change?
The climate is different from the weather. It is the average weather we experience over a long period of time. This includes temperature, wind and rainfall patterns.
The climate of the earth is always changing. These changes are due to natural causes, the effects of the sun, land, oceans and atmosphere.
Humans are changing current climate through the production of greenhouse gases in the atmosphere such as carbon dioxide (CO2), methane and nitrous oxide. In 2004, CO2 made up 85% of the UK’s greenhouse gases released into the atmosphere.
How do greenhouse gases change the climate?
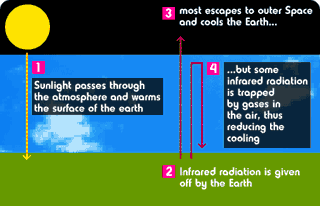

Greenhouse gases remain in the atmosphere for long periods, and act as a 'blanket' around the earth absorbing the infra-red radiation from the earth and radiating it back to warm the lower atmosphere – the greenhouse effect. Without this effect the earth’s temperature would be 20 to 30°C colder and less suitable for life. Carbon dioxide occurs in the atmosphere naturally. The introduction of more CO2 by humans increases greenhouse gases and leads to more heat being trapped and global warming.
What do we do that causes CO2 to be released into the atmosphere?
Most scientists now agree that it is humans that are causing higher levels of CO2 to be released into the atmosphere.
6.5 billion tonnes of CO2 is released into the earth's atmosphere each year through human activities. 2% is released by the UK. (Source: Defra)
Where’s the evidence?
How do scientists know that greenhouse gases, such as CO2 are increasing?
Evidence that carbon emissions have increased over the years are measured through air trapped in ancient ice cores in Antarctica and Greenland. These show a gradual rise from 1800 – the beginning of the Industrial Revolution and the burning of fossil fuels in power stations, factories and cars. Since the 1950s, direct measurements have been made of carbon in the atmosphere from the observatory at Manua Loa in Hawaii.
These measurements show that the concentration of carbon dioxide in the atmosphere – measured in parts per million (ppm) has remained around 280 ppm for 650,000 years but in the last few years has increased to more than 385 ppm.
Most scientists agree that this increase is due to the burning of fossil fuels. The main reasons for an increase in carbon emissions are a growth in population and the increase in the amount of energy people use as we own more goods, enjoy more services and travel more.
The use of energy per person varies greatly across the world.
Compare the map of energy use per capita with the table of the world’s biggest emitters of CO2.
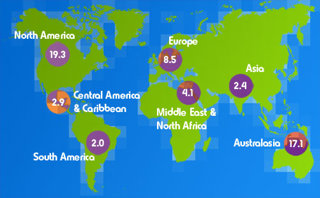
 Tonnes of energy use per capita. Source: International Energy Agency
Country, Million tonnes of CO2 in 2002:
-
United States, 6,928
-
China, 4,938
-
Russia, 1,915
-
India, 1,884
-
Japan, 1,317
-
Germany, 1,009
-
Brazil, 851
-
Canada, 680
-
United Kingdom, 654
Source: World Resources Institute
Together, the 25 countries with the largest emissions account for around 83% of world emissions.
Why is this so important?
How do scientists predict the future?
Scientists study future changes and impacts of the climate using climate models based on an understanding of physical processes. These models have improved over the years as knowledge of the earth’s climate system has developed and the speed and power of computers have increased.
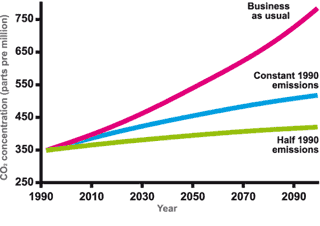
Scientists model a range of future possible climates using different scenarios. Each scenario makes different assumptions about factors such as how the world's population may increase and use energy supplies, what technological innovations there may be and how our behaviours may adapt to future changes. They can give us a reliable guide to future climate change although some uncertainty remains.
Source: Hadley Centre for Climate Prediction and Research
If future emissions follow the ‘business as usual’ projection, then CO2 concentration in the atmosphere will more than double over the next 100 years
If global emissions remain at current levels, concentrations would still go on rising
If global emissions were cut in half, concentrations would still increase
Even if we stopped releasing any more CO2 into the atmosphere today, the world's climate is still predicted to warm in the future. This is because of the 'residence' time of CO2 which lasts about 100 years in the atmosphere.
As CO2 emissions have been rising, so has the global temperature. Since 1900, the average temperature of the earth’s surface has warmed by 0.6°C. All of the ten warmest years on record since 1861 have occurred since the beginning of the 1990s. 1998 was the warmest year on record and 2005 was almost as warm. The global average temperature measurements are taken from thousands of weather stations across the world on land, from ships at sea and more recently satellites.
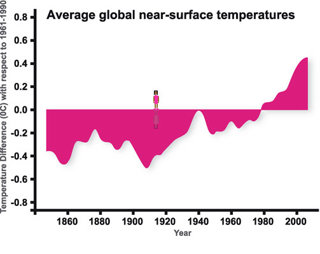
Source: Hadley Centre for Climate Prediction and Research
Some activities in some parts of the world could initially benefit from climate change, for example Northern Europe could experience less demand for heating so using less energy. There could also be a longer growing season for crops for farmers. But higher temperatures are also likely to increase the number of heat waves, severe storms and flooding through sea level rise and the melting of large ice sheets in Greenland, the Arctic and Antarctica.
What does global warming mean for the UK?
Future scenarios are based on low carbon emissions and high carbon emissions for the years 2020, 2050 and 2080.
First, download the maps, then look at the questions below:
-
What will be the change in temperature in the summer of 2080 where you live?
-
What will be the change in the amount of rainfall in the winter of 2080 where you live?
-
Which places do you think will be affected most by climate change?
-
Which is likely to be affected the least?
-
How do you think they will they be affected?
Changing sea levels
An example of global warming is changing sea levels. As the global climate warms, the world’s oceans will expand, causing a rise in the average level of the sea. Many land glaciers will melt, adding to this rise in sea level. Sea level will continue to rise around most of the UK’s shoreline, although the change in the level of the sea relative to the land will not be the same everywhere because much of southern Britain is sinking and much of northern Britain is rising! It is extreme sea levels – as experienced during storm surges – that cause most coastal damage. The largest rise in extreme sea levels may occur around the southeast coast of England, a region which has the largest changes in winds and storms.
What is our carbon footprint?
How do we know the amount of CO2 that we are responsible for so that we can take steps to reduce it? Our individual carbon footprint measures the amount of carbon dioxide produced as we go about our everyday lives. It is measured in tonnes of carbon dioxide emitted into the atmosphere. CO2 is produced by the burning of fossil fuels which is used to provide energy for our homes, by the cars we travel in and by the manufacture and transport of goods we buy. In the UK, each person produces, on average, 11 tonnes of carbon a year. (Source: Carbon Trust)
How does the way you live your life contribute to CO2 emissions?
Before you start exploring any of the other sections of this site, fill in the questionnaire:
Carbon footprint questionnaire
After completing any of the units of work, fill in the form.
Can I cut my carbon?
Are there things you can change to reduce your carbon footprint?
Are we able to adapt?
Even if we stop burning fossil fuels and cutting down forests today, the world's climate will still warm in years to come.
As well as mitigating against our carbon emissions, we need to adapt to a changing climate, from the buildings we live and work in, to the way we travel, to where we go on holiday, to the plants and flowers we grow in the garden and the food we buy in the shops.
File nameFiles
File type
Size
Download