Copper in the 21st century
Mineral security
Copper is an important metal which has become increasing crucial to top exporters and consumers in the developed world. The reasoning behind the surge in demand is that electrical equipment has exponentially increased as production costs have gone down, and consumer spending has gone up. The global COVID-19 pandemic has increased pressure on copper supplies as many countries in the western world have seen an increase in home entertainment, gaming, and the growing electrification of transport, all of which requires copper wiring.
Copper is a non-ferrous metal and is an example of a mineral. Reserves, export/imports, global commerce, and the environmental impacts of copper extraction are all key elements of studying mineral security in A Level geography.
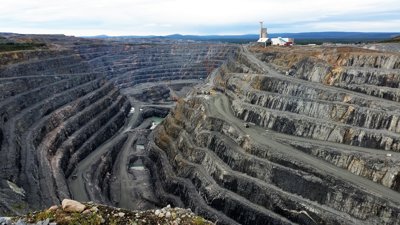
Figure 1 Boliden Aitik, Sweden’s largest open pit copper mine © Neta623 Pixabay
The specification
AQA A Level 3.2.5.5 Mineral security with reference to iron ore or a specified globally traded non-ferrous metal ore e.g., copper, tin, manganese.
Edexcel 7.6.a Superpower resource demands (food, fossil fuels, and minerals) can cause environmental degradation and carbon emissions contribute disproportionately to global warming.
OCR 2.b. The use of ocean energy and mineral resources is a contested issue.
WJEC Development in Sub-Saharan Africa 4.3.9 The influence of resource base of minerals and energy sources on development.
Introduction
Copper is shiny and reddish in colour. It was first used over 10,000 years ago during the Bronze Age. It was during this time that humans started to work with metal, specifically by adding tin to copper to make a harder and more durable metal for weapons and tools. It is now the third most used metal in the world.
The element copper is a low reactivity metal, found as nuggets in the ground, called native copper. The 3 main ores are: chalcopyrite, bornite, and malachite. 50% of copper production comes from chalcopyrite making it the most common source.
In the Earth’s crust metals are split into abundant metals: aluminium, iron, magnesium, manganese, and titanium, and scarce metals: copper, lead, zinc, gold, and silver. Copper is classified as a scarce element (see Table 1 in Appendix A) because it is only present in the Earth’s crust at a concentration of about 67 parts per million.
Over time, the importance of copper to human civilisation has lessened. However, in the twenty-first century copper is once again being touted as a precious metal because demand levels have surged whilst supply issues persist. It has the following end uses:
-
Electrical wiring (it is ductile, and can be drawn into thin wires)
-
Domestic plumbing (it is biostatic, preventing bacteria growth (producing safe drinking water)
-
Boiler and heat exchanges (long-term degradation does not occur; it is corrosion resistant)
-
Making brass (copper is mixed with zinc, producing an alloy — strong and tough)
-
Making coins (although a modern-day copper coin is now 97.5% zinc)
-
Electrification of transport (it is an excellent conductor of electricity — and heat)
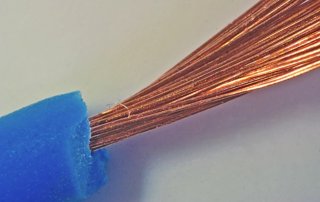
Figure 2 stripped electrical wire © Tudor Barker
Copper use in electric cars is linked to efficiency due to energy savings — this can help extend the life of the car. A conventional internal combustion engine (ICE) car has between 8 and 22 kilograms of copper in it, compared to a hybrid electric vehicle (HEV) which has approx. 39 kilograms, a plug-in hybrid electric vehicle (PHEV) with 60 kilograms, and a fully electric (EV) containing 83 kilograms of copper.
Copper is one of the most efficient thermal-electrical conductors we have and is therefore essential for the renewable energy sector.
Copper deposits
Copper deposits are classified on the basis of how they form. There are multiple major deposit classes but the main two are: porphyry copper deposits (PCD), and sediment-hosted copper deposits (SCD). All copper ores are the result of hot and high-pressure geothermal solutions bringing the copper up to cool near the surface.
PCD are found in volcanic areas when hot, metal-bearing fluids percolate up through the Earth’s crust. Copper is then released into ‘veins’ in the rock, creating disseminated copper deposits. This occurs by a process called mineral precipitation — when ions in solution come together to form solid minerals i.e., copper. PCD is a major deposit class because it is currently the world’s main source of copper (50-60% of world production).
Copper is also found in SCD, such as sandstone and shale, when the metal-bearing fluids become chemically trapped in the rock strata. SCD is the world’s second most important source of copper accounting for approx. 20% of world production.
There are other rarer deposit examples throughout the UK: volcanic stratabound (NW Scotland), volcanic massive sulphide (Isle of Anglesey), mafic-intrusion (NE Scotland), vein-style (SW England, Lake District, and central Wales), the Breccia pipes (N Wales), Skarn-type (Dartmoor), and Epigenetic deposits in limestones (English Midlands).
The 2007 British Geological Survey (BGS) commodity profile for copper states that the amount of copper accessible for land surface mining is 1.6 billion tonnes, with a further 0.7 billion tonnes available in deep-sea nodules.
South America has the largest measured amount of copper in the world. In 2019 Chile was the world’s leading copper producing country, making 5.787 million tonnes of copper. Table 3 in Appendix C shows the top 5 copper producing countries of 2015 versus 2019.
Future trends for copper
In the past it was thought that copper supply disruption was a low risk.
The COVID-19 pandemic has rapidly increased copper demand, particularly in the electronics industry. Throughout 2020 there has been a sustained uptick in consumer electronics. For example, after stay-at-home orders were issued in March 2020, smart phones, televisions, e-games, and games consoles became even more desirable. As a result, copper demand (and price) also grew in 2020. It is expected to continue to grow by up to 600% (relative to 2021) by 2030, compared to current levels, with warnings that global supply might become increasingly strained across the world.
A recent article in the Economist laid out the future possibilities for mining copper, explaining that pretty much all the non-ferrous natural resources that are currently excavated come from ancient volcanoes. Scientists now suggest that copper may be drilled from deep copper-sulphide ores which have formed as sulphur-rich gases have risen up through active volcanoes and encountered metal-rich brines trapped in the rocks above the magma, in the same way as oil is exploited.
In the UK another future possibility is the rediscovery of disused copper mines that might once again become financially viable as the price of copper rises. In 2020, a surprise discovery of copper was uncovered in the Cornish parish of Gwennap, near Redruth. The mineral company Strongbow Exploration hopes the United Downs mine will be at the forefront of a renaissance for Cornish mining.
Peak copper is difficult to estimate because the copper is almost completely recyclable. Approximately 35-40% of world demand is currently met by recycling the metal, while in Europe as much as 50% of copper-use is from recycled sources. In spite of this peak copper remains a useful indicator of the global economy’s health due to the diversified nature of the metal’s end uses.
Go to the ArcGIS dashboard Worldwide copper production in 2019 to visualise where copper was mined in that year (ArcGIS Online for Schools is free to access).
In Cornwall, the plan for United Downs mine is to continue additional drilling to find out just how big the zone is. For Gwennap, which was once the richest copper producing region in Cornwall, a resurgence just might be in sight.
Activity
1. Using the data in Appendix A Table 1, draw a pie chart to represent 2019 copper production for the top 10 producers.
2. Go to the USGS Global copper map, describe the global distribution of both PCD and SCD.
3. Now go to the USGS prospective map for global copper deposits. Which regions of the world have future potential for:
a. Porphyry copper (PCD)
b. Sediment-hosted copper (SCD)
4. Study the data in Appendix C Table 3. Which country increased their production the most between 2015 and 2019?
5. Which country’s production decreased?
6. Go to page 41 on Copper in the British Geological Society’s report on Stream sediment geochemical atlas of the United Kingdom (click the download button). Describe the pattern of copper deposits in the UK.
7. Go to the ArcGIS dashboard Worldwide copper production in 2019 using your ArcGIS school log-in (free for schools). Which country was the number 1 producer of mined copper that year?
8. Analyse the spatial pattern of copper production across the world in 2019.
9. Is there another way to visual this dataset? Take the information for the top 20 producers and create your own infographic on copper in 2019.
Appendix and answers are available in the downloadable PDF document.
Further reading
-
People may one day drill for copper as they now drill for oil (email sign up to read for free)
-
Travelling through deep time to find copper for a clean energy future
-
Five reasons Strongbow Exploration’s latest discovery could be transformational
-
USGS 2021 Mineral Commodity Summaries Annual Publications report data
This resource was first published in 2022.