Lesson one
Key question
Where is Taiwan and what is it like?
This lesson should follow a sequence of work where the class have explored the formation and distribution of tropical storms.
Taiwan, and in particular the two valleys within the research area, is particularly vulnerable to large typhoons because of its location within the tropics. On average Taiwan receives five typhoons annually. The potential impact of the typhoons is exacerbated because this region is also geologically very weak, and prone to massive landslides, debris slides and flooding. Inhabitants within the valley are increasingly at risk from typhoons. Government policy towards disaster management is piecemeal. Although improvements have been made, local inhabitants are increasingly distrustful of central government who has suggested that it may be better to relocate the population to safer and less vulnerable areas.
This lesson sets Typhoon Morakot into context by highlighting Taiwan’s economic position and considering the location in which the research was carried out.
Useful Weblinks
Starter
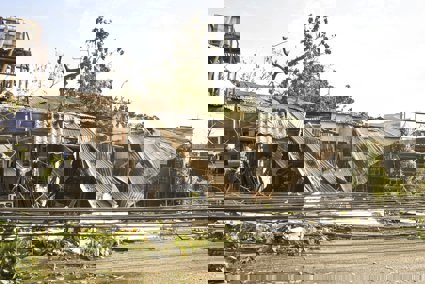
Open the starter PowerPoint and consider the picture reveal activity. Draw an annotated sketch of what you expect to see in the lower half of the photo.
Alternatively, you can write a paragraph describing what you see. This is an opportunity to reinforce the difference between describe and explain, a vital examination skill.
Once the photo is revealed, use the photo frame to suggest what may be happening in the image. How would this link to what you have already learned about tropical storms?
The image shows workers securing the steep hillside after a landslide.
Main Activity
Use an atlas, Google Earth, Bing maps or another mapping website to describe Taiwan’s location. Use the coordinates below to visit the former site of Xialoin village and show the location. The coordinates mark roughly the centre of the village before Typhoon Morakot.
Coordinates: N 23o 29’45.13 E 20o 38’ 37.33
Zoom to ground level and use Street View (if using Google Earth) along Route 21 to consider the evidence of landslides, the relief of the area and vegetation. The geology in this valley is very weak and prone to landslides, especially after heavy precipitation.
Next, we shall consider the economic context of Taiwan. The GDP per capita of the UK in 2012 was US$31,295 and its life expectancy 80 years of age. Try to predict the GDP per capita and life expectancy of Taiwan and what impact this would have on the country’s ability to cope with disasters. Use Gapminder World to visualise this. Select the United Kingdom and place a sticky note or mark where you expect Taiwan to be. You may also wish to consider other countries that have experienced natural disasters such as Haiti.
Taiwan’s GDP per capita in 2012 was US$32,841 and its life expectancy was 79. Is this surprising? What effect would this have on disaster management?
According to this report by the World Bank, Taiwan leads the world in the proportion of people exposed to the number of natural hazards. This can be visualised in Gapminder World. Taiwan and its mountain communities are affected by typhoons, intensive rainfall, steep mountain slopes and fast flowing rivers that often flood.
Plenary
Revisit the former location of Xiaolon Village by displaying the coordinates above on Google Earth. Imagine you are researchers setting up a research station is this area to map hazards. You have been asked to help brief the scientist team. First, rank the hazards that affect this region using the table, and then give an explanation for each ranking. Which combination of disasters would be the most deadly?
Preparation for next lesson
Consider what you would want to take with you if you were asked to evacuate your home and why.