Lesson two
Key questions
What were the causes of the disaster
Were the causes were entirely natural?
On August 7 2009, Typhoon Morakot slammed into Taiwan. Its mountain communities were not prepared for the storm and Xiaolin Village was wiped from the map. This lesson considers the causes of the disaster and asks whether the causes were entirely natural.
Starter
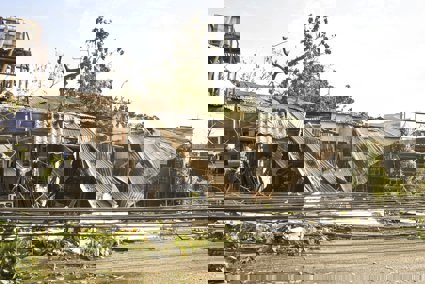
Use the starter activity PowerPoint, which shows building that were used as community shelters during the typhoon. Think, pair, and share your response to the question given on the PowerPoint.
You might want to think back to the previous lesson where you visited the area virtually, and think about its poor geology and steep sided hillsides.
In reality, both of these buildings were designated as typhoon shelters for the local community. Consider the disadvantages of both buildings, for example, glass on all sides. The second building is a school which was in the path of a landslide. You can use the video at the top of this news report to consider what a landslide is.
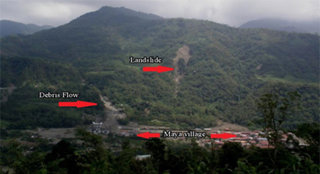
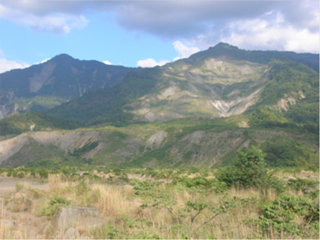
The image above is useful for setting the context of the village. The school can be seen at the right of the photograph. This image clearly shows the relief of the area and how its relative geological weaknesses are evidenced through the presence of landslips and debris flows.
Main Activity
Consider the images here which show some of the effects of Typhoon Morakot in 2009. Taiwan is an economically developed country with GDP per capita equal to that of the UK.
Next, print off copies of this graph, enough for one between two. It shows the precipitation levels in the Namasia valley during Typhoon Morakot.
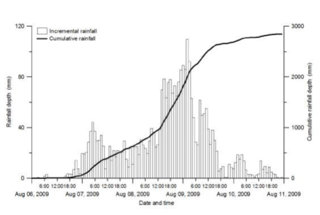
In pairs, sit back to back. One of you has the map and the other a mini whiteboard or some paper. The student with the map has to describe the graph while the other draws it. Your teacher might provide you with a pre-drawn axis. This activity develops pupils’ graph description skills.
Now you have seen the real graph, answer this question:
Describe the pattern of precipitation between the 6 and 11 of August 2009. Refer to graph evidence in your answer (4)
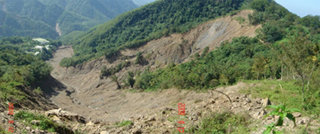
In order to put these figures in to context, get a metre ruler and measure the precipitation values in the classroom. The image below is useful as it shows the source of a landslide. Students should appreciate the steepness of the slope and the direction of flow of the slip itself.
We are now going to consider the effects of this on the village of Xiaolin in the Namasia Valley. Using the coordinates from the first lesson, use the time slider option in Google Earth to compare the satellite images from 2001 and 2009. You will see that the village is completely wiped from the map.
Next, using the card sort activity (Xiaolin village causes and effects), sort the cards into causes and effects. You should write ‘C’ on the cards which are causes and ‘E’ on those which are effects. Next, sort them into physical and human causes and effects. The cards contain the place specific detail needed for case-study examination answers.
The image below was taken in 2012 and shows the location of the Xiaolin landslides.
Finally, consider the question: ‘Was the Xiaolin village disaster caused by human or natural factors?’
Plenary
Next consider the following examination-style case study question:
For a climatic disaster that you have studied, describe its main causes and effects.
You should include place specific detail and make three well developed points. Use the cards from the card sort activity to identify important information and link multiple points.