Lesson two: Data analysis
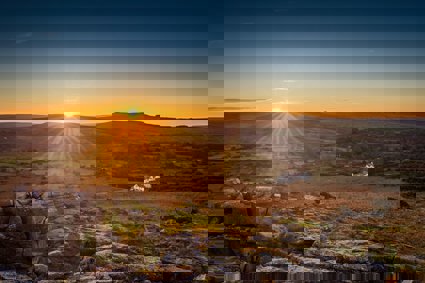
Rose spent five months working on the heather moorlands exploring the changes that were taking place in a number of locations around the moor. She had to spend one hour at each of the 30 sites per month, catching insects and carrying out other data collection.
This lesson explores some of the techniques that Rose used to discover the extent to which the peat was recovering.
Starter
Watch the birds and the bees presentation that Rose and her colleagues put together to explain their work to students. This explains what they were looking for, and the data that they collected, which was basically made up of two main components.:
-
Details on the vegetation that was growing
-
Details on the insects that were attracted by the vegetation
Reconstruct the basic food chain using the food chain sheet, which should be cut up to make cards which can be arranged in the correct sequence.
Main Activity
Rose collected data in several different ways.
The data collection involved following a range of line transects. A transect is a line across an area. This can be of a particular width, or be carried out at intervals across an area. It provides a system for the sampling that follows.
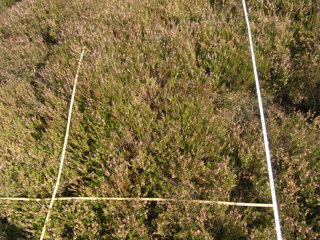
Rose used quadrats for her data collection. A quadrat is a square of a known size. In Rose’s case they were one metre square, created using bamboo canes which were laid on the heather. See the image below - these canes were easier to carry than other forms of quadrats.
Traditional surveys involve putting a quadrat down on the ground in locations which are decided in some systematic way, for example every 10 metres along a transect, or are placed at randomly determined locations. Rose could not look at the whole moor, so she had to have a way of choosing samples which were then representing the whole moor. You will be trying this out on the school grounds in the area that you have identified in the next lesson.
Imagine choosing one person to represent your whole group. Who would you pick and why?
Where do you think you would find the greatest diversity of species?
Rose was looking at the heather and other plants on Bleaklow. Take a look at this image which she took, which shows a quadrat.
-
How many plant species can you see?
-
Where might the other plants be that are within this quadrat?
-
Would most of the quadrats look like this one do you think?
Bees are the main pollinator on the moorlands, although other insects are also involved. Rose had to travel to the moorland regularly and catch bees to carry out a range of tests on them to see how well established the ecology on the moorland had become.
The Fieldwork flowchart worksheet contains a description of what she had to do, day after day, at locations around this remote moorland. Cut out the cards in advance.
You should discuss, and try to put the cards in an appropriate order to tell the story.
After you have had a go at this, read the following description from Rose of what she did, so that you can check the order, and also to help those who are unsure of the order.
“I collected flower visiting insects from five different moorland areas in different stages of restoration from bare peat to fully intact and covered in heather. I spent one hour at every sample site (30 hours per month), from May to Sept. This was the period when there were flowering plants to attract the bees. I walked in a systematic pattern and collected every “plant-pollinator interaction” that I observed i.e. every insect pollinating a flower. The insects (usually bees) were caught in a sweep net and transferred into a glass tube with an I.D. numbered bag and a disc of paper tissue soaked in ethyl acetate to euthanize (kill) the animal. The plant which the insect was visiting was also recorded next to the I.D. number of the bag. All insects were then frozen to avoid decomposition.
Vegetation transects were also carried out (2 x 20m transects with a 1m quadrat placed every other meter, resulting in 20 quadrats per plot) were carried out on every plot (again, this meant that the work was repeated 30 times). I recorded vegetation diversity, percentage cover, height in the centre of the quadrat and the number of floral units per species. This information tells us the resources available for pollinators on each site as well as a tool to assess the success of vegetative restoration.”
Rose ended up with large amounts of data, and a box of dead bees. She took them back to the lab to carry out further work with them.
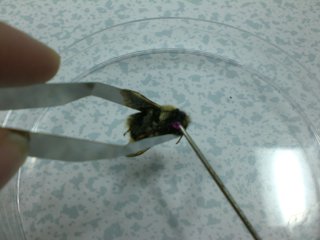
“In these pictures I was swabbing the bees for pollen with a fuchsian gel. The gel pulls pollen grains off the insect and they can then be melted onto a glass slide and mounted with a cover slip to allow the pollen grains to be identified under the microscope . The bees were then checked for internal and external parasites.”
The presence of parasites would suggest that the networks that should exist on the heather had been re-established, and suggest that it was a success.
Do you think you would have the patience for this type of work?
Plenary
Rose’s work is about the role of network ecology. This is all about the connections between the different parts of the ecosystem. The relationship between the various sections of the ecological network are similar to those of the social networks like ‘Facebook’. Imagine that you are going to create a page on a social networking website for Bleaklow. This is the area of heather moorland that has been studied here.
Suggest what would be appropriate elements of the page, for example who would the friends be, which groups would it belong to etc.
Design your own social network page to incorporate your ideas for Bleaklow.