What are the Small Gases?
The main gases responsible for changing our climate are carbon dioxide (CO2), methane (CH4), water vapor (H2O), and nitrous oxide (N2O). In the past these gases have created a natural greenhouse effect which worked to keep average global temperatures at an ambient 14°. However, since the onset of the industrial revolution, human activities have added excessive amounts of all the greenhouse gases (GHGs) to the atmosphere. The Chair of the IPCC, said in the Sixth Assessment Report:
It shows that climate change is a grave and mounting threat to our wellbeing and a healthy planet. Our actions today will shape how people adapt and nature responds to increasing climate risks.
Hoesung Lee, Chair of the IPCC
Our atmosphere is vital to life on Earth as it contains the oxygen we need to live, creates pressure to maintain liquid water, makes the planet habitable, and protects us from harmful ultraviolet solar radiation. It is described as Earth’s ‘security blanket’.
Excessive pollution of greenhouse gases has led to a sustained increase in global temperatures and more extreme weather events – precipitating the term ‘climate change’. As a result, over the next two decades, the world now faces unavoidable multiple climatic hazards due to a minimum global warming of 1.5°C2.
The specification
AQA 3.1.1.4 Water, carbon, climate, and life on Earth. The role of feedbacks within and between cycles and their link to climate change and implications for life on Earth.
Edexcel Topic 6: The Carbon Cycle and Energy Security. 6.7.c Climate change, resulting from the enhanced greenhouse effect, may increase the frequency of drought due to shifting climate belts.
OCR Topic 3.1 – Climate Change. 2. How and why has the era of industrialisation affected global climate?
WJEC 4.5: Weather and Climate. 4.5.4 Extreme weather events.
The authors
This teaching resource is designed to promote the international bestseller, Small Gases, Big Effect by David Nelles and Christian Serrer.
The RGS-IBG extends a special thank you to David and Christian for their work with the Society, to their publishers, Penguin, and the illustrators Stefan Kraiss, Lisa Kauert (formerly Lisa Schwegler), and Janna Geisse who have kindly included their drawings in this educational resource.
You can listen to our podcast with the authors on iTunes, Soundcloud, or Spotify, titled The surprise bestseller: Small Gases, Big Effect by David Nelles and Christian Serrer.
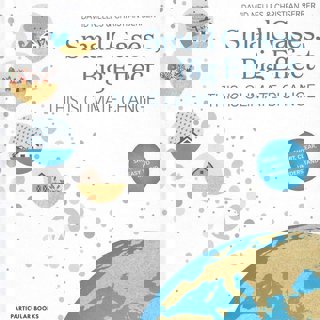
Figure 1 Small Gases, Big Effect © Penguin
Extracts from the book
To begin the book distinguishes between changes to climate and changes to weather:
Climate refers to the average weather conditions over a long period of time – a period of at least 30 years, according to the World Meteorological Organisation. In contrast to the weather, therefore, the climate changes very slowly. A 5°C drop in temperature from one day to the next is completely different from the climate cooling by 5°C. In the latter case, we would be plunged into conditions resembling the last ice age.
David Nelles and Christian Serrer
Climate change is fueled by the burning of hydrocarbons. Approximately 85% of CO2 emissions are created from burning fossil fuels to generate energy. The remaining amount is split between cement production (5%) and land use change (10%). In Figure 2 below the blue diagram shows how the energy derived from fossil fuels is used (in 2014). The illustration underneath shows the combination of coal, oil, and gas to fossil fuel emissions.
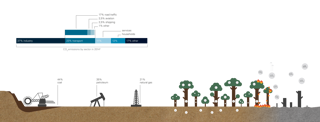
Figure 2 carbon dioxide emissions p40-41 © Stefan Kraiss, Lisa Kauert (Schwegler), and Janna Geisse
CO2 remains the most abundant and dangerous of the GHGs however increasing attention is now focused on CH4. Methane is described as a ‘potent gas’. This is because, if a little more is added to the atmosphere, it can have a big impact on how much and how quickly the planet warms. On a 100-year timescale, it is 28 times more powerful than CO2 at warming the Earth. As a result, in 2021 a UN report identified methane as a key gas in the fight against climate change. The report identified the ‘urgent steps’ required to keep global warming within the 1.5°C limit set by the 2015 Paris Agreement. Methane is a powerful GHG and, despite pandemic lockdowns throughout 2020 and 2021, the levels are rising. Since 1970 methane concentrations have risen by more than 150% and continue to grow.
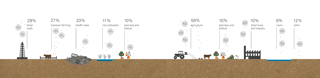
Figure 3 methane emissions (left 5 statistics) and nitrous oxide emissions (right 5 statistics) p42-43 © Stefan Kraiss, Lisa Kauert (Schwegler), and Janna Geisse
Table 1 below shows the increase in atmospheric methane from 1984 to 2020.
|
Year |
Increase CH4 parts per billion |
Uncertainty |
|
1984 |
12.83 |
0.84 |
|
1985 |
12.31 |
0.91 |
|
1986 |
12.90 |
0.65 |
|
1987 |
11.40 |
0.72 |
|
1988 |
10.80 |
0.55 |
|
1989 |
11.08 |
0.59 |
|
1990 |
8.71 |
0.47 |
|
1991 |
14.05 |
0.55 |
|
1992 |
2.40 |
0.51 |
|
1993 |
3.82 |
0.59 |
|
1994 |
7.21 |
0.61 |
|
1995 |
3.96 |
0.56 |
|
1996 |
2.51 |
0.48 |
|
1997 |
6.25 |
0.69 |
|
1998 |
12.15 |
0.70 |
|
1999 |
2.39 |
0.65 |
|
2000 |
-1.48 |
0.54 |
|
2001 |
-0.72 |
0.56 |
|
2002 |
3.23 |
0.56 |
|
2003 |
4.79 |
0.57 |
|
2004 |
-4.85 |
0.42 |
|
2005 |
0.34 |
0.41 |
|
2006 |
1.93 |
0.56 |
|
2007 |
7.84 |
0.57 |
|
2008 |
6.53 |
0.44 |
|
2009 |
4.67 |
0.41 |
|
2010 |
5.20 |
0.71 |
|
2011 |
4.86 |
0.58 |
|
2012 |
5.00 |
0.51 |
|
2013 |
5.71 |
0.58 |
|
2014 |
12.77 |
0.50 |
|
2015 |
10.01 |
0.70 |
|
2016 |
7.07 |
0.67 |
|
2017 |
6.89 |
0.79 |
|
2018 |
8.68 |
0.52 |
|
2019 |
9.80 |
0.64 |
|
2020 |
15.57 |
0.38 |
Table 1 the global trend of CH4 since 1984 © NOAA
Figure 3 shows that around 60% of methane emissions are from human sources. These sources are the 1.4 billion cows on the planet who belch and release flatulence, the bacteria in flooded rice paddy fields, extractive industries (i.e., oil and gas), and the decomposition of waste (in particular food waste) from landfill sites.
Natural sources of CH4 come from volcanology, naturally burning landscapes, wetlands, and thawing permafrost in the Arctic.
Thawing permafrost is a huge environmental problem as the process exposes thousands of years of plant and animal remains to microbial decomposition (see Figure 4). This decomposition in turn releases further CO2 and CH4 creating a harmful positive feedback loop. Vast swaths of permafrost in the northern hemisphere have begun to suffer from abrupt permafrost thaw, described by the Carbon Brief as one of nine ‘tipping points’. Once organic matter in permafrost decomposes, releasing CO2 and CH4, there is no going back.
Further problems arise in permafrost areas when land collapses from thawing. This process can leave a pockmarked landscape with thermokarst lakes, filled with snow and meltwater. These wet conditions can lead to the release of more methane.
Permafrost stores around 1.5 trillion metric tons of organic carbon, twice as much as Earth's atmosphere.
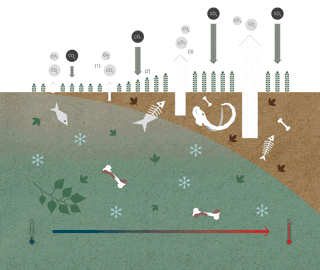
Figure 4 permafrost p62-63 © Stefan Kraiss, Lisa Kauert (Schwegler), and Janna Geisse
Figure 5 shows the other impacts from thawing permafrost. One example is unstable subsoil which can lead to ground deformation and damage to human infrastructure. You can learn more about the impact and financial cost of thawing permafrost in the teaching resource pack Climate Change and the Russian Arctic.

Figure 5 other consequences of thawing permafrost p64-65 © Stefan Kraiss, Lisa Kauert (Schwegler), and Janna Geisse
Water vapour is another GHG. Figure 6 illustrates the 4-step process of the formation of atmospheric water vapour. Ultimately, additional water vapour intensifies the greenhouse effect adding to the increasing rise in temperature. Once initiated, this is self-accelerating.
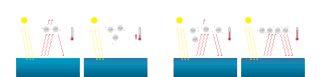
Figure 6 water vapour feedback p70-71 © Stefan Kraiss, Lisa Kauert (Schwegler), and Janna Geisse
The increasing levels of carbon dioxide, methane, nitrous oxide, and water vapour are fuelling climate change. In general terms, the climate is becoming more unpredictable and warmer. Record-breaking temperatures and heatwaves are becoming more common whilst cool spells and cold extremes are less frequent.
The diagram in Figure 7 illustrates the difference in extreme hot and cold weather between earlier climates and our current climate today.
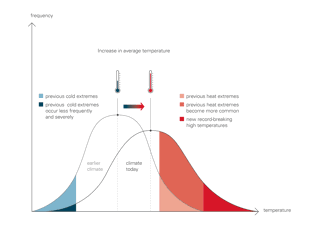
Figure 7 extreme hot and cold weather p78-79 © Stefan Kraiss, Lisa Kauert (Schwegler), and Janna Geisse
The plight of pikas are a small example of a specific impact from climate change. North American pikas are highly temperature-sensitive mammals (closely related to rabbits and hares) which don’t hibernate and rely on snow cover insulation to keep their burrows warm. However, due to a retreating snowline (and lack of insulting snow), these creatures are in danger of freezing to death.
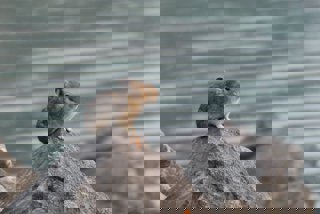
Figure 8 a pika © Derek Ryder Unsplash
Similarly, the broad tailed hummingbird will also suffer the effects of climate change due to a phenological shift. Broad tailed hummingbirds migrate from Central America northwards to the mountains to breed every summer. Due to climate change these birds have started to arrive earlier to their northernmost breeding sites. Higher temperatures now mean the flowering season for nectar-rich plants has shifted forwards, effectively reducing the time between the birds’ arrival and the flowering of their food source.
Similarly, the broad tailed hummingbird will also suffer the effects of climate change due to a phenological shift. Broad tailed hummingbirds migrate from Central America northwards to the mountains to breed every summer. Due to climate change these birds have started to arrive earlier to their northernmost breeding sites. Higher temperatures now mean the flowering season for nectar-rich plants has shifted forwards, effectively reducing the time between the birds’ arrival and the flowering of their food source.
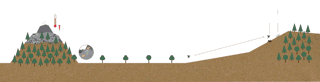
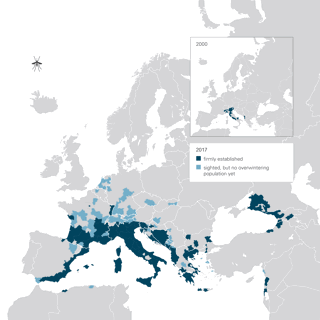
Figure 9 the plight of the pikas and hummingbirds p96-97 © Stefan Kraiss, Lisa Kauert (Schwegler), and Janna Geisse
Figure 10 vector-borne diseases p108-109 © Stefan Kraiss, Lisa Kauert (Schwegler), and Janna Geisse
Vectors are organisms which can transmit pathogens from an infected animal or person to another. Figure 10 highlights one of several health implications stemming from climate change – and from globalisation and migration.
In this case higher temperatures are facilitating the westwards expansion of the Asian tiger mosquito, which has traditionally been confined to the tropical areas of southeast Asia. These insects are capable of transmitting pathogens such as dengue fever, yellow fever, zika, and chikungunya.
The pace of global warming is completely altering insect populations, with some species dying out and others thriving. The Asian tiger mosquito is spreading throughout southern Europe due to climate change.
In the UK some insects will survive the changes, such as dragon flies, whilst many others, namely the pollinators, will perish.
An example of a declining insect is the bumblebee – populations in North America have halved whilst European numbers have declined by 17%.
Agricultural practices, as well as climate change, are responsible for the global biodiversity crisis. Worldwide, the demand for food has led to habitat loss, over-exploitation, and fragmentation. Table 2 shows example activities which affect global biodiversity: the food system, logging activities, development or disturbance, fires and water management, climate change, other species, energy and mining, and pollution.
|
|
Habitat loss |
Direct mortality |
Other activities |
|
Food system
|
15,376 |
6,398 |
3,598 |
|
Logging or resource use |
10,713 |
3,962 |
2,982 |
|
Development or disturbance |
7,376 |
1,767 |
2,915 |
|
Fire and water management |
7,087 |
2,640 |
1,986 |
|
Climate change and weather |
3,337 |
1,542 |
1,723 |
|
Other species
|
2,621 |
3,597 |
3,060 |
|
Energy and mining
|
3,632 |
1,141 |
987 |
|
Other pollution
|
2,217 |
401 |
280 |
Table 2 number of species threatened with extinction affected by various human activities © IUCN 2016 data
Weather extremes are likely to have a bigger and bigger impact on crop yields. On the left of Figure 11 the 3 tractors represent a low to moderate increase in yields linked to a 1-2°C increase in global temperature (compared to pre-industrial levels).
The optimum growth level is marked in the middle of the image, this will differ around the world due to different experiences of climate change, and different types of crops. Once this optimum growth level is exceeded there will be a sharp decline in crop yields due to heat, drought, or weather unpredictability (represented by the tractors to the right).
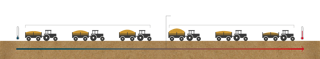
Figure 11 Agriculture p112-113 © Stefan Kraiss, Lisa Kauert (Schwegler), and Janna Geisse
Activity
-
Study Figure 2. Which fossil fuel accounts for the largest share of emissions generated by burning fossil fuels?
-
What does the forested part of Figure 2 represent?
-
Describe the change in atmospheric CO2 by completing the following steps:
-
Go to the Our World in Data page for CO2 and greenhouse gas emissions
-
Scroll down to the subtitle Atmospheric concentrations of CO2 continue to rise
-
Click Download and select Full data (.CSV)
-
Delete column A Entity and column B Code
-
Select all the rows (down to 1872) and click the Insert tab
-
Click Recommended Charts and select the first one (a scatter chart)
-
Describe the graph
-
Study Figure 3. What is the main source of methane and the main source of nitrous oxide?
-
Study Figure 4. Moving left to right in the image, as the permafrost layer thaws, what changes do you see?
-
Study Figure 5. What damage to human infrastructure can you see in the image?
-
Study Figure 6. Describe what is happening in each of the 4 steps for water vapour feedback.
-
Create a bar graph to illustrate the data from Table 2. x axis is Number of species affected; y axis is the 8 Direct threats.
Further reading
-
Small Gases, Big Effect can be purchased from Hive (online network of 360 independent bookstores nationwide), Wordery, or Waterstones as well as other major book retailers
-
UN IPCC Sixth Assessment Report press release 28 February 2022
-
The National Geographic Methane, explained
-
Our World in Data CO₂ and Greenhouse Gas Emissions
-
The Guardian How the speed of climate change is unbalancing the insect world