March 2014
The 31 January 2014 saw the beginning of the Chinese New Year – the Year of the Horse. Firecrackers and fireworks are traditionally used in many Chinese New Year celebrations. However, in 2014 in many Chinese cities people were encouraged not to use them, to avoid adding to the continued air pollution problem experienced in many urban areas in China.
The levels of pollution in Beijing routinely exceed safety limits set by the World Health Organisation (WHO). Many people, especially children frequently wear face masks in urban areas to try and filter the polluted air.

Levels of air pollution in Chinese cities have been a growing problem for many years. With industrialisation and rapid urbanisation air quality has been significantly reduced in many urban areas in China:
-
In October 2013 in many Chinese cities some schools were forced to close and traffic was brought to a standstill.
-
One school in Beijing has taken measures to protect its pupils by building a completely indoor playground so that children are not exposed to the pollution. The giant inflatable dome at the International School of Beijing has filtered air. The construction of the dome was prompted after children were kept indoors at break time for 20 days in a row due to extremely high pollution levels.
-
In Beijing in December 2013 the air quality got so bad that the levels of air pollution went beyond the scale provided by the US Environmental protection Agency, the Air quality Index.
-
In January 2014 four major roads were closed: Beijing to Shanghai, Daqing to Guangzhou, Beijing to Harbin and Beijing to Pinggu which meant that travel around the country became restricted.
-
The smog in Harbin was so thick that many roads had to be closed because visibility was less than 20m in places.
The Air Quality Index
The Air Quality Index produced the US Environmental Protection Agency is measured on a scale of 0-500 and is used by many people as an indicator of when people should stay indoors. Frequently the air quality in Beijing has gone beyond the 500 value meaning that the air quality is highly hazardous. You can see below the different levels of pollution as defined by the Air Quality Index. The Index is calculated for five major pollutants: ground-level ozone, carbon monoxide, sulphur dioxide, nitrogen dioxide and particulate matter (PM2.5 and PM10).
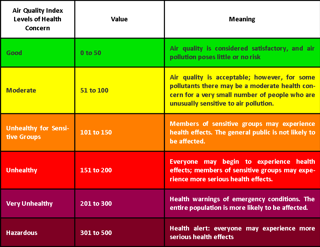
Source: Air Now, 2013
-
You can check the live Air Quality Index in Chinese cities on the US State Department website.
-
It is also possible to compare live data for air pollution indicators in many Chinese cities here: (including PM2.5, PM10, SO2, NO2 and CO).
On 7 December 2013 there was a thick haze of smog that stretched from Beijing to Shanghai (over 1,200 km). On the satellite image the polluted air appears grey while the clouds appear white.
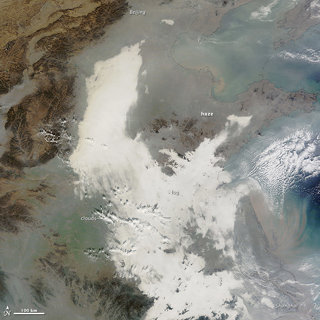
Satellite image of China showing extent of the air pollution in December 2013, Source: NASA
PM 2.5 Concentrations
While monitoring of overall levels of pollution have caused alarm, the levels of PM 2.5 concentrations as a component of this air pollution have caused particular concerns.
PM 2.5 is particulate matter that has the diameter of 2.5µm (micro metres) which is around 1/30 the width of a human hair. This means it is small enough to enter into the human lungs and even into the blood system, and therefore has serious health implications.
The WHO has set a maximum safe limit of exposure to these particles to 25 per cubic metre of air.
Many Chinese cities regularly experiences levels of PM2.5 and PM10 well above 200 per cubic metre (Beijing has even reached 800).
Until recently data on PM2.5 was not released by the Chinese government, readings could only be based on those published by the US embassy however the policy was changed due to pressure via social media.
You can monitor the Beijing levels via twitter or Shanghai.
You can also view pollution levels for London.
Causes of the pollution problem
The Environmental Performance Index (produced by Yale and Columbia universities) ranks countries according to air quality (calculated form a number of indicators).
According to their 2014 Environmental Performance Index China ranks overall 118 out of 178 countries. This is based on indicators for air quality, water quality, sanitation, forest and fishery conservation and climate control policies. However, it was the worst ranked country (178 out of 178) for PM2.5 concentrations.
There are a number of reasons why the pollution problem has developed in China:
-
The use of coal in China has increased ten-fold since 1960s. Rapid growth in population, industrialisation and urbanisation has meant that demand for and use of, the amount of fossil fuels used has increased dramatically.
-
Much of the air pollution is blamed on coal-fired power plants.
-
Growth in population, and in particular a rising number of people who can afford the use of a car has meant there has been a rapid rise in the number of vehicles in cities.
-
In many northern Chinese cities coal fired heating systems are still used, which means additional pollution is produced.
-
In some cities the landscape makes the problem worse. For example Beijing is surrounded by hills which can result in pollution remaining trapped, particularly if there is little wind.
According to the US Energy Information Administration coal supplies the majority of energy consumption in China as much as 70% (while oil is 19%, hydroelectric is 6%, natural gas is 4%, nuclear is 1% and other renewables around 0.3%). However, China has set targets to raise their energy consumption from non-fossil fuel sources by 2015.
Costs and Solutions
The Chinese Academy for Environmental Planning has estimated that it will cost ¥1.7 trillion Yuan (around £180 billion) between 2013 and 2017 to be able to significantly reduce the pollution in the skies. The Chinese government have recognised the need to address the pollution problems. From March 2014, no further oil refining, steel, cement and thermal power plants will be permitted in Beijing. In a five-year action plan, the Chinese government stated it would try to reduce the level of airborne particulates (PM2 and PM10) by at least 10% in major Chinese cities by 2017.
The Chinese government has already invested ¥1.7 trillion Yuan (£180billion) to clean up power stations and traffic fumes. Officials in China are confident that green technology will help overcome the country’s air pollution problem and that just like other cities they can progress from polluted to cleaner cities.
The BBC conducted an interview with a senior environmental official:
"You can see those big cities like in London in Britain, Los Angeles in America and Tokyo in Japan, they all had huge air problems in the past – for example, London was nicknamed Smog city – which was caused by fast industrialisation…We have already moved fast to cope with this issue. So we are very confident about reaching a good level of air quality and changing our capital into a Green Beijing in the future" ( BBC News, 2014).
A growing global issue
There are also studies which suggest that the pollutants are drifting back across the Pacific Ocean to the extent that a quarter of the sulphate pollution in the Western US originates from China as seen in the map produced by the University of California, Irvine. Black carbon is particulate matter (also known as PM 2.5) and is produced by incomplete combustion of fossil fuels, biofuels and biomass.
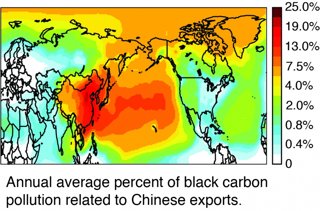
A co-author of the study that produced this map blamed the increased pollution on the movement of production of goods to China with the result that: "we’ve outsourced our manufacturing and much of our pollution… but some of it is blowing back across the Pacific to haunt us." (Bloomberg News, 2014).
Other studies have highlighted the impact of air pollution on health suggesting that air pollution in China has contributed to 1.2 million premature deaths in 2010 due to a shortened lifespan caused by air pollution. However, this is not a problem that is confined to China, it is a global issue. The Organisation for Economic Cooperation and Development (OECD) has warned that "urban air pollution is set to become the top environmental cause of mortality worldwide by 2050.
A map from the NASA Earth Observatory shows the areas where the most deaths are caused by air pollution. The heavily polluted areas are shown in the deep brown colour. In addition to China it is possible to see there is also a belt in India, from Delhi to Calcutta.
Premature deaths from air pollution
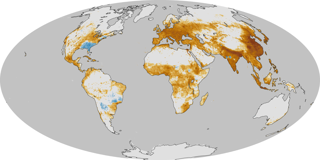
It is estimated that there are now 1.78 billion people who regularly breathe air with pollution levels which are two and half times greater than what the World Health Organization deems safe. This has risen from 606 million in 2000.
References
‘Airpocalpyse smog hits Beijing at dangerous levels’ New York Times 16 January 2014
‘Air pollution linked to 1.2 million deaths in China’ New York times 01 April 2013
‘Beijing bans refining steel, coal power to curb pollution’ Reuters 22 January 2014
‘Beijing sees sharp fall in tourism’ China Daily 13 January 2014
‘China Smog crackdown boosts high grade iron ore’ Financial Times 28 January 2014
‘China smog emergency shuts city of 11 million people’ Reuters 21 October 2013
‘China Smog prompts call for ban on Lunar New Year Fireworks’ Huffington Post 29 January 2014
‘China Smog reaches all the way to Los Angeles’ Bloomberg News 21 January 2014
‘Could China combat smog with artificial rain?’ New Scientist 05 December 2013
‘Desolation of Smog’ BBC News 07 January 2014
‘Harbin Smog crisis Highlights China’s smog problem’ National Geographic 22 October 2013
‘India and China besieged by air pollution’ New York Times 27 January 2014
Made in China for us: Air pollution as well as exports’ UCIrvine News 20 January 2014
‘Opportunity beckons in China smog’ New York Times 30 December
‘Smog in New Delhi is worse than in Beijing’ Business Week 28 January 2014
‘The global toll of fine particulate matter’ NASA Earth Observatory 12 September 2013
‘US Energy Information Administration: China’
‘Weather authorities want to see ban on fireworks’ China Daily 29 January 2014
File nameFiles
File type
Size
Download
