
A new recipe for economic development
August 2014
Calculating a country’s Gross Domestic Product (GDP) is like baking a cake: there is a recipe you are supposed to follow so that you can make comparisons between countries. However, as the economies of many countries grow and become more complex their GDP recipes are changing.
For example, across African countries agriculture was previously always one of the most important ingredients. But times are changing across the continent. Telecoms, services, media and manufacturing are all now booming. Recently, Nigeria, Kenya and Ghana all introduced a new set of GDP calculations, bringing staggering rises in each case – with Nigeria’s GDP doubling, making it Africa’s largest economy. Kenya’s rise requires its re-classification as a middle-income country. Parallel to this, the World Bank has modified how it adjusts GDP figures for the purpose of making international comparisons. New formulae are being used that better reflect the varying cost of living in different countries. As a result of these accounting changes, China, previously worth two-thirds of the USA, is now poised to take the number one spot as the world’s largest economy! India has jumped from sixth to third place, overtaking Japan and Germany at a stroke. From a development studies perspective, these are clearly very important changes to be aware of.
Gross Domestic Product (GDP)
GDP is a measure of the total value of the output of final goods and services inside a nation’s borders. Each country’s annual calculation includes the value added by any foreign-owned businesses that have located operations there. It is one of the best known measures of national and global prosperity used by the World Bank, which recently estimated global GDP in 2011 at about US$90 trillion.
Estimating GDP is not an easy task. Numerous earnings of citizens and businesses need to be accounted for, not all of which are easily recordable. Illegal or unregistered work in the informal sector is also notoriously hard to quantify.
Individual countries make a calculation of their GDP each year, using globally agreed guidelines (overseen by the United Nations). Data are generated using a country-specific formula for an agreed base year. The base year formula establishes the weighting given to different economic sectors, such as agriculture and industry. This same weighting – or set of sums - is re-applied in future years. Each sector’s value is updated accordingly. The figures are then verified by international organisations such as the International Monetary Fund, the World Bank or the African Development Bank.
The next step is to convert all of the national GDP estimates into a common currency, US dollars, in order for comparisons and ranking. This measure of economic prosperity has become central to how economic development is measured. In UK schools geography, whether a country is categorised as rich or poor, developed or developing, high-income (MEDC) or low income (LDC) is often determined principally by GDP per capita (when the figure is divided by population size to provide a proxy measure for the average income level of citizens living in different states).
In the past, the volatility of exchange rates meant that GDP data were not always strictly comparable between countries in terms of what they showed. Economists believe that, at the same time as they are converted into US dollars, each country’s GDP data should additionally be manipulated so that an estimate of the real cost of living, known as purchasing power parity or PPP, is factored in. Simply put, in a low-cost economy, where goods and services are relatively affordable, the GDP should be increased and vice versa. This is why, if you consult Wikipedia, you will find two estimates given of every country’s GDP. Brazil, for instance has a ‘nominal’ GDP of US$2.17 trillion in 2013, and a ‘PPP’ GDP of US$2.52 trillion. This suggests that the price of, say, a Big Mac, is relatively cheaper in Rio than it is in New York! Can you see why this is the case?
During 2014, newspapers have reported striking new claims about global wealth and development:
-
China is about to overtake the USA to become the world’s number one economy
-
Nigeria has doubled its GDP ‘overnight’ to become Africa’s largest, ahead of South Africa
It is important to emphasise that no sudden step-change has taken place in the amount of cash in the average Nigerian’s pockets, nor indeed the cash carried in Chinese pockets; although there have been the creation of additional wealth over the longer term due to economic growth. Rather, the new facts we are hearing about are a product of changes in how national wealth data are measured and manipulated. The new facts are a product of (i) national governments changing what they include in their calculations and (ii) the World Bank applying new formulae to make international comparisons.
African countries re-calculate how their GDP is measured
Individual countries can alter how their GDP is calculated in two important ways. Firstly, it is possible to change what is included and what is not. For instance, Nigeria’s national film industry, known as Nollywood, had previously been excluded from the country’s GDP data. Recently, a decision was taken to include this sector (it now takes up 1.4 per cent of Nigeria’s GDP). Also, the potential inclusion of illegal commerce, such as prostitution, smuggling or drug dealing, is an issue that every country – whether African or European - must address (see below).
Secondly, at certain intervals, the base year against which GDP growth is measured (as outlined above) can be changed. The big changes we have seen recently in African GDPs are a product of this. Regular changes in base year are advised by the World Bank because a sector that was very economically important in the base year will continue to appear very important ‘despite structural changes that may have occurred since the last base year. Conversely, sectors that were unimportant or not even existing will barely have an impact on the official statistics’ (Guardian, 20 November 2012). Recently, African countries have been making long overdue adjustments, with interesting results:
-
Nigeria overtakes South Africa: This ‘leap-frogging’ was done by bringing forward the base year for calculations to 2010 from 1990, when the structure of Nigeria’s economy had been very different and services such as banking and telecoms had barely taken off (Financial Times, 07 April 2014). Newly updated figures have nearly doubled estimates for GDP. As a result, Nigerian GDP for 2013 was US$509 billion, 89 per cent larger than previously thought. Agriculture’s share of GDP moves down from 35 per cent to 22 per cent. Contrastingly, telecoms moves up from just one per cent of GDP to 9 per cent. Nollywood earnings have also been included in the calculation for the first time
-
Kenya’s economy is a fifth larger than previously estimated According to its own new formula, Kenya’s GDP was US$50 billion in 2013. This equates with a per capita figure that lifts Kenya as a whole out of low-income into middle-income status. The base year for calculations is now 2009, rather than 2001, and gives a larger share to profitable manufacturing and communication sectors that, while still small, are growing rapidly (Financial Times, 13 June 2014)
-
Ghana’s GDP doubles in size Ghana’s GDP rose more than 60 per cent when it adopted a new base year in 2010, suggesting that in the previous estimates about US$13bn worth's of economic activity had been missed! As a result, Ghana was abruptly upgraded from a low to lower-middle-income country (Guardian, 2 November 2012)
The entire African continent’s GDP could rise from US$1.5 trillion to US$2 trillion if all African countries were to make similar revisions to take into account changing industrial and employment structures.
The Financial Times (07 April 2014) points out, however, that the new figures ‘do not put more money in the pockets of the common man. More than 60 per cent of Nigeria’s population is thought to live in severe poverty while, at the top end, a new generation of multimillionaires and billionaires has emerged’. However, the figures show us that there is more wealth in Nigeria than had been thought (albeit the wealth is unevenly distributed), and, logically, that the country is more economically developed than many people had believed.
‘Prostitutes and drug dealers give Britain a £10bn boost’
This quote comes from a report in the Financial Times (29 May 2014). The UK’s GDP recipe was recently changed to include more informal sector activity, which ranges from drug dealing to ‘cash in hand’ construction work, and is increasingly accounted for in the GDP data of European nations. Under EU rules, informal transactions should be counted providing that both parties have consented. The UK will join Estonia, Austria, Slovenia, Finland, Sweden and Norway in adding prostitution and illegal drugs to its GDP, adding about 5 per cent in overall value. Some illegal activities were already included in the UK’s GDP, including smuggling. The Office for National Statistics believes prostitution will add £5 billion to GDP and drug sales another £4 billion.
The World Bank changes how GDP comparisons are made
In April 2014, new World Bank purchasing power parity (PPP) figures were provided by its International Comparison Program. This research provides the ‘most authoritative estimates of what money can buy in different countries’. Older formulae from 2005 have now been abandoned in favour of new ways of measuring national wealth that reflect the ICP’s new finding that ‘money goes further in poorer countries than it previously thought’. This has resulted in some significant changes in the rank ordering of countries. China and India are notable risers in the table.
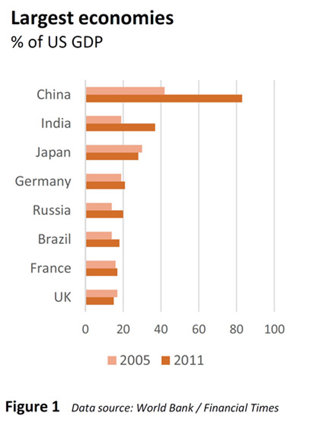
As a result, there have been significant upheavals in the global ranking of economies (Figure 1).
-
China will overtake the USA in 2014 to become the world’s largest economy, according to the World Bank. Leading economists previously thought China would pull ahead in 2019 (prior to the great recession of 2008, the year 2028 had been predicted)
-
India has become the World Bank’s third-largest economy, having previously been in tenth place. The size of its economy almost doubled from 19 per cent of the USA in 2005 to 37 per cent in 2011
And what of GDP per capita, that all-important measure of economic development?
-
The five economies with the highest GDP per capita are Qatar, Macao SAR, Luxembourg, Kuwait, and Brunei. The first two economies have more than US$100,000 per capita
-
Just eight economies – Malawi, Mozambique, Central African Republic, Niger, Burundi, Congo, Dem. Rep., Comoros and Liberia – remain with a GDP per capita of less than US$1,000
Re-drawing the global poverty map
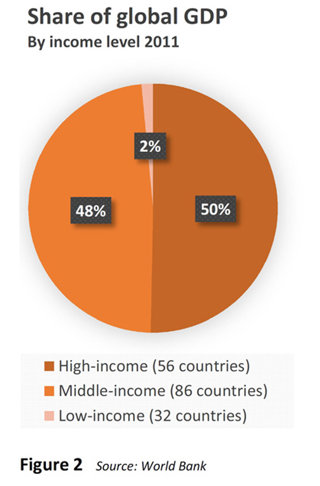
The changes reported by the World Bank have a big impact on how we view the world. Firstly, the number of low and middle income countries is changing (Figure 2). This is a result of rises in average GDP per capita, due to a combination of re-basing and changes in how PPP is calculated. Kenya is just one country that needs to be re-classified as middle income (Financial Times, 13 June 2014).
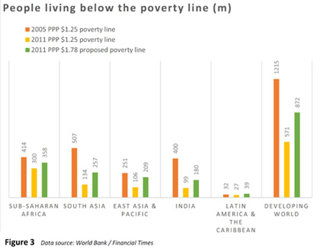
Once figures are converted into per capita measures, the new data have important implications for the numbers of people who are officially designated as living above or below the poverty line. As a result of the World Bank’s change in methods, the number of people living on less than US$1.25 a day has been potentially halved from 1,200 million to 600 million. This is simply staggering. It represents the disappearance – statistically speaking – of half the world’s poorest people. The Financial Times (09 May 2014) emphasises that:
-
this represents a fall from almost 20 per cent of the developing world’s population to fewer than 9 per cent
-
in India alone the number of people living on less than US$1.25 a day fell from 393 million of the country’s 1.2 billion people to just over 100 million based on the 2011 numbers
The new data have big policy implications as they will inform discussion of what objectives should replace the UN’s millennium development goals (MDGs), which have shaped international aid policy since 2000 and expire in 2015. For example, the first of the MDGs aimed to halve the number of people living in absolute poverty by 2015 and this target will have been met. So what are the implications for studies of developmental change over time, especially those relating to the MDG targets? How are expected to study growth trends over time if the data for different years have been calculated in different ways? The answer is not clear.
Do we need a new poverty line?
Controversially, the World Bank’s Poverty Unit believes that the official poverty line needs to be raised from the US$1.25 a day measure to as much as US$1.78 a day. This has been done in the past: the line was increased from US$1.00 to US$1.25 in 2008, which resulted in an additional 400 million people in the developing world becoming classified as ‘extremely poor’.
Even if the poverty line were to be re-drawn at US$1.78 in 2011 PPP, the number of people living in extreme poverty worldwide would still have fallen by almost a third to 872 million, which is good news (Figure 3).
Thinking critically about quantitative measures of development
How trustworthy are the data we use routinely? Are they a valid representation of real life? Important questions such as these should always be asked in the social sciences, including human geography.
For an interesting classroom discussion, begin by reviewing the following ’facts’:
-
In 2005, the World Bank thought China’s economy was less than half the size of the USA, accounting for only 43 per cent of the American total. But because of changes in how the World Bank handles its data, the latest research places China’s GDP at 87 per cent of the US in 2011
-
In 2010, Ghana was ranked as one of the poorest countries in the world. After changing its GDP formula, Ghana was re-classified as an aspiring middle income country
-
In the UK, the Office of National Statistics (ONS) has added £5 billion to the value of the UK’s GDP by including prostitution. To come up with this figure, the ONS made a number of assumptions. Statisticians have suggested that each of the UK’s estimated 60,879 prostitutes took about 25 clients a week in 2009, at an average rate of £67.16. These estimates are based on a survey in London that year. The ONS has also used data from the Netherlands to assume prostitutes spent the equivalent of €125 a year on clothes and €0.50 a client on condoms in 2007. The Financial Times (29 May 2014) includes a quote from the ONS: ‘This is a weak assumption based on the market for prostitutes’ services. It is necessary because we have no time series data for the number of prostitutes.’
So just how valid and reliable are the GDP data that geographers routinely make use of?
A Guardian journalist has this to say about it: ‘The short answer is that they are poor. This is not just a matter of technical accuracy – the arbitrariness of the quantification process produces observations with very large errors and levels of uncertainty. This "numbers game" has taken on a dangerously misleading air of accuracy, and the resulting figures are used to make critical decisions that allocate scarce resources. International development actors are making judgments based on erroneous statistics. Governments are not able to make informed decisions because existing data are too weak or the data they need do not exist.’
Did you know?
The findings of the World Bank’s Poverty Unit report provides a useful snapshot of the world in 2011. Here are just some of its findings.
-
The world’s rich countries still account for 50 per cent of global GDP while containing only 17 per cent of the world’s population.
-
Low income economies account for only 1.5 per cent of the global economy, but nearly 11 per cent of the world population.
-
Roughly twenty-eight per cent of the world’s population lives in economies with GDP per capita expenditures above the US$13,460 world average and 72 per cent are below that average.
-
The approximate median yearly per capita expenditures for the world – at US$10,057 – means that half of the global population has per capita expenditures above that amount and half below.
-
Six of the world’s twelve largest economies are in the middle income category. When combined, the twelve largest economies account for two-thirds of the world economy, and 59 per cent of the world population.
-
The six largest middle income economies – China, India, Russia, Brazil, Indonesia and Mexico – account for 32.3 per cent of world GDP, whereas the 6 largest high income economies – United States, Japan, Germany, France, United Kingdom, and Italy – account for 32.9 per cent.
-
South Africa, Egypt, and Nigeria account for about half of the African economy.
-
The four most expensive countries to live in are Switzerland, Norway, Bermuda and Australia, with the cheapest being Egypt, Pakistan, Myanmar and Ethiopia.
References
Financial Times 07 April 2014 ‘Nigeria almost doubles GDP’
Financial Times 13 June 2014 ‘Kenya increase size of economy by a fifth’
Financial Times 30 April 2014 ‘China economy set to overtake US’
Financial Times 29 May 2014 ‘Drugs and prostitution add to UK economy’
Guardian 20 November 2012 ‘Lies, damn lies and GDP’
Financial Times 09 May 2014 ‘World Bank eyes increase to poverty line’
World Bank 29 April 2014 ‘International comparison program results’
Written by Dr Simon Oakes, chief examiner in diploma geography for the International Baccalaureate who teaches at Bancroft’s School, Essex.
File nameFiles
File type
Size
Download