The Brazilian climate
This lesson was created to develop pupils’ data collection skills
Within this lesson, the working wall can be developed to include key vocabulary, terminology and definitions. Examples of labelled climate graphs can also be displayed and used in conjunction with the lesson’s success criteria. Following the lesson, evidence of pupil work can be added to the working wall as well. If there is a map of Brazil displayed on the working wall, create arrows to the key locations with climate graphs for each.
Key questions
What does the geographical term ‘climate’ mean?
What does the geographical term ‘weather’ mean?
What is the difference between climate and weather?
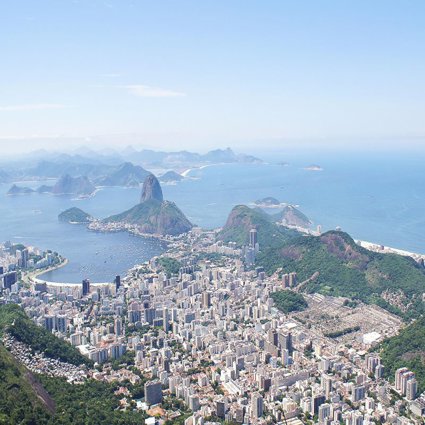
Why did the England football team not want to play in Manaus, Brazil?
Where is Manaus located? What geographical region is Manaus in?
Pupils will have the opportunity to develop and create their own climate graph, using data from real sources.
Pupils will begin to analyse and evaluate climate data.
Pupils will begin to draw conclusions and make comparisons between climate data.
Additional Resources
-
Graph paper, ruler, red and blue coloured pencils
-
Computer access (optional)
-
Globe
Starter
The lesson will begin with a question. Pose the following question to the pupils:
-
Why did the England football team not want to play in Manaus?
Allow the pupils time to think about the question, before allowing them to discuss their ideas as a table group. After that, encourage the pupils to discuss their answers as a class. As with the discussion in the previous lesson, encourage pupils to use PEE (point, evidence, explanation) to develop their answers. Pupils should be encouraged to use their maps from the previous lesson to remind them of the location and geographical region Manaus is located.
Once initial discussion is over, play the video clip in which Roy Hodgson (England football manager) discusses why he did not want the England team to play in Manaus during the 2014 World Cup. Go to the BBC Sport website. Pupils should watch the video clip before discussing the question further: Why did the England football team not want to play in Manaus? Pupils should now be able to develop their answers and support with evidence from the video.
Main Activity
Having discussed the reasons why the England football team did not want to play in Manaus (mainly linked to the climate) move the discussion on to what is meant by climate.
-
What is meant by the geographical term: climate?
Climate means the average weather conditions in a particular location based on the average weather experienced there over 30 years or more. -
How is climate different to weather?
Weather describes the condition of the atmosphere at a particular time. It might be sunny, hot, windy or cloudy, raining or snowing. Climate is what we ‘expect’. Weather is what we ‘get’.
Provide pupils with an opportunity to write their own definitions of the geographical terms: climate and weather. These words and definitions could also be included on the working wall to remind pupils of the correct terminology throughout the unit.
Next, explain to the pupils that within this lesson they will be comparing the climate of different locations in Brazil in order to find a more suitable location for the England football team to play.
-
Why do you think geographers compare the climate of different locations?
-
What will this information teach them?
-
What climate do you think the footballers would prefer? Why?
Present the pupils with the locations they will be focusing on: Brasilia, Manaus, Salvador, Rio de Janeiro, and Curitiba. To refresh the pupils’ knowledge and understanding of the locations of places within Brazil ask the question:
-
Can you locate these places on a map of Brazil?
-
This activity could take place as a whole class, using the map on the PowerPoint. Alternatively, the pupils could be presented with an individual map of Brazil and atlases and asked to locate the places independently.
-
How do you think the climate of these locations will differ? Pupils to discuss their thoughts with a partner before reporting back to the class.
Following this, the teacher should ask the question:
-
How do you think geographers present climate data?
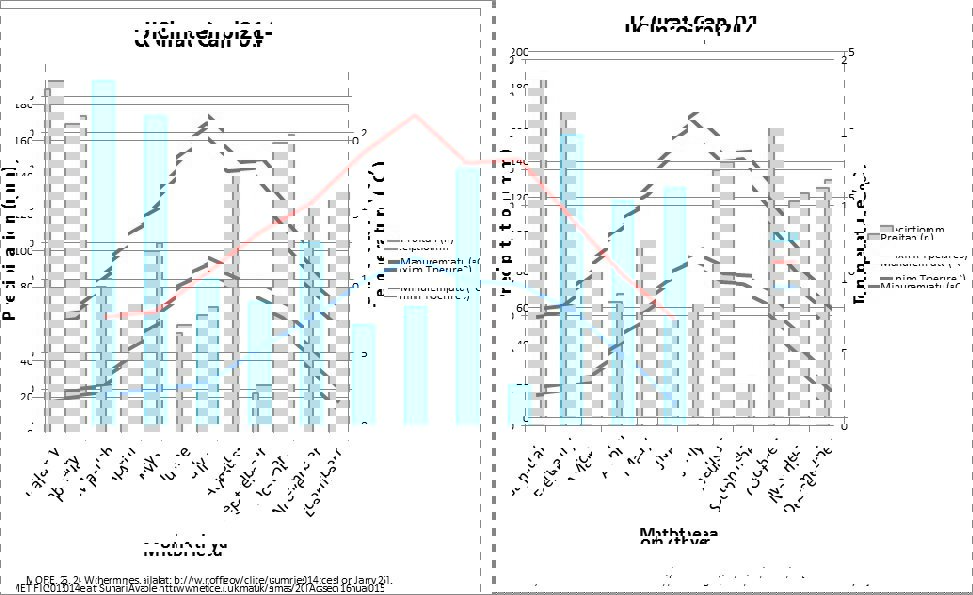
Using the Brazilian Climate PowerPoint, the teacher should show pupils examples of climate graphs, explaining that climate graphs are used to represent the rainfall and temperature of a certain location over time. The teacher should use this opportunity to explain that the pupils will be studying the average data from each of the locations. Emphasise that some climate graphs show the highest and lowest temperatures and rainfall as a line graph (because temperature is continuous), although they will be focusing on the average. Precipitation is always show as a bar graph.
Pose the question:
If I wanted to form success criteria for drawing a climate graph, what should be included?
Teacher to allow pupils to discuss their ideas, then form success criteria as a whole class. This is to be placed on the working wall. An example of the success criteria is included in the Brazilian Climate PPT and includes the following information:
-
Title
-
Bar chart for rainfall and line graph for temperature
-
Label the x axis
-
- months
-
Label the y axis
-
- rainfall in millimeters (mm)
-
- temperature in Degrees Celsius
-
Include a key
If pupils have little experience of drawing graphs the teacher should at this point model creating a climate graph on the whiteboard to ensure all pupils understand the task clearly.
Using the Climate Data of the different locations (see downloadable resources); the pupils will be given the opportunity to draw their own climate graphs for the one of the locations provided.
Differentiation
-
Higher ability pupils: could be encouraged to present more than one data set on their climate graph. Teacher could model using a compound bar chart to represent the rainfall and a line graph of different colours to represent the average temperature.
-
Middle ability pupils: to create two climate graphs for different locations which they can compare in the plenary.
-
Lower ability pupils: to be supported by the teacher or teaching assistant with this task. Pupils could be given a pre-prepared graph in which the pupils have to add the data.
Once the pupils have created their climate graphs they should be encouraged to use the success criteria to ensure they have met all of the aspects covered.
Plenary
The lesson will conclude with a discussion about the climate data and graphs the pupils have created. Pupils will be given time to compare their graphs with pupils who have chosen to look at different locations to themselves.
The teacher should explain that the pupils will be writing a conclusive paragraph about their climate graphs. Explain that their paragraph should describe and explain what their data shows them about the climate of Brazil. The following key questions can be used to guide the pupils work and ideas:
-
When is the rainfall highest/lowest in your location?
-
When is the temperature highest/lowest in your location?
-
Does this differ to the other location you have studied?
-
Do you think that this would be a better location for the England football team to play? Why?
If time allows, the teacher could develop the pupils’ understanding of the climate graph data by comparing it to what they know and understand about the climate of the UK (see UK Climate Graph 2014 JPEG). The teacher could use the following key questions to develop their thinking:
-
When would you expect to see the highest/lowest rainfall in the UK?
-
Is this the same as in Brazil?
-
When would you expect to see the highest/lowest temperatures in the UK?
-
Is this the same as in Brazil?
-
Which hemisphere is the UK in? Which hemisphere is Brazil in?
-
How would this affect the climate in each location?
-
How close is the UK to the equator?
-
How close is Brazil to the equator?
-
How will this affect the climate?
During the key questioning pupils could be shown maps of the world, allowing them to locate the Northern and Southern Hemispheres and the equator. If pupils do not have a prior knowledge and understanding of these topics, the teacher could lead the discussion and use a globe to model.