What evidence do we have of climate change?
This module will help students to understand:
-
Is the world’s climate changing?
-
What is the evidence for climate change?
Has the number of extreme events changed?
As the Earth’s climate gets warmer, the likelihood of some extreme events such as heat waves increases. Remember the European summer heat wave in 2003? Well, scientists believe, the risk of a similar summer has doubled due to human activities such as fossil-fuel burning.
Determining whether a specific, single extreme event is due to a specific cause, such as increasing greenhouse gases, is difficult for two reasons: 1) extreme events are usually caused by a combination of many different factors and 2) a wide range of extreme events is normal even in an un changing climate.
However, we can talk about changes to the risk of extremes. The likelihood of some extreme events, such as heat waves, has increased with the changing climate, and the likelihood of others, such as extremely cold nights, has decreased. For example, a recent study estimates that human influences have more than doubled the risk of a very hot European summer like that of 2003.
In some regions there have been increases in droughts and floods. The number of days of very heavy rain have in creased in some places. Tropical storm and hurricane fre quencies vary considerably from year to year, but evidence suggests substantial increases in intensity and duration since the 1970s.
How has the climate changed in the past?
The Earth’s climate has always changed, long before we humans existed!
There have been warmer and colder periods. For example, in the last ice age, 20,000 years ago, it was about 9°C colder than it is now. The causes of most of these changes are very well understood.
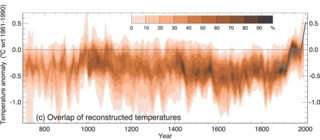
Northern Hemisphere temperatures for 600-2000AD
Intergovernmental Panel on Climate Change (2007) IPCC Fourth Assessment Report. Climate Change. [Accessed June 2009]
-
This graphic shows Northern Hemisphere temperatures for 600-2000AD
-
The vertical, y axis shows how different the temperature is from the average of 1961 - 1990 temperatures
-
The horizontal, x, axis shows time in years from 700 - 2000AD
-
We cannot be certain about what the globally averaged surface temperature was hundreds of years ago
-
The temperatures measured recently are warmer than any likely to have happened in the last 1300 years
How has the climate changed in the recent past?
Current global tempera tures are warmer than they have been during at least the past five centuries, probably for more than 1000 years. The 17 warmest years on record have all occurred in the last 20 years.
During the 20th century there have been two ‘warming phases’: from the 1910s to the 1940s (0.35°C), and more strongly from the 1970s to the present (0.55°C).
Alongside the warming, there has been an almost worldwide reduction in the extent and mass of glaciers in the 20th century. We know that the Greenland Ice Sheet is melting, that the thickness and extent of sea ice in the Arctic have decreased in all seasons and that sea level is rising due to thermal expansion of the oceans and melting of land ice.
Instrumental observations over the past 150 years show that air temperatures at the Earth’s surface have risen globally.
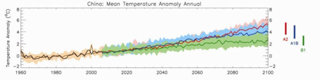
How did China’s temperature change between 1960 and 2100?
McSweeney, C., New, M. and Lizcano, G. (2009) Climate Change Country Profiles - China. Oxford University School of Geography and Environment and the Tyndall Centre for Climate Change Research. Report commissioned by the British Council, RMetS, RGS-IBG for Climate 4 Classrooms p28
-
The black line shows the actual temperature anomaly for each year from 1960 to 2000. This is the difference in temperature between the year’s recorded temperature and the average of all years between 1970 and 1999. If the anomaly is positive, that year was warmer than the 1970-1999 average. If it is negative, that year was colder than the 1970-1999 average
-
The brown line shows past temperature anomalies as produced by a computer model with the brown shading showing the range of temperatures produced by the model
-
Mean annual temperature has increased by 0.8°C since 1960, average rate of 0.18°C per decade. Rate of 0.36°C per decade
-
Temperature increases are particularly rapid in the Northern regions in the Winter (DJF)
-
The green, blue and red lines show projected future temperatures from 2006 to 2100, according to three different emission scenarios – green (low), blue (medium) and red (high). The shading around each line shows the range of temperature that might be possible with each emission scenario
-
The coloured bars summarize the range of temperatures for each emissions scenario
-
All scenarios show future temperatures will be warmer
-
Mean annual temperature is projected to increase by 1.3°C to 3.5°C by the 2060s and 1.7°C to 5.5°C by the 2090s
-
Projected rate of warming is greatest in winter (DJF) with increases of 2.0°C to 6.4°C projected by the 2090s
-
Projected increases are most rapid in northern and western regions of China, with projected increases in annual mean temperature of around 2°-6°C in the northern regions and the Tibet Plateau (regions A, B, C and F), but more moderate increases of around 1.5°‐5°C in regions D and E
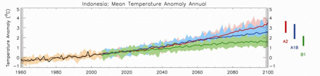
How did Indonesia's temperature change between 1960 and 2009?
McSweeney, C., New, M. and Lizcano, G. (2009) UNDP Climate Change Country Profiles - Indonesia. Oxford University School of Geography and Environment and the Tyndall Centre for Climate Change Research. Report commissioned by the British Council, RMetS, RGS-IBG for Climate 4 Classrooms p9
-
The black line shows temperature anomaly for each year from 1960 to 2000. This is the difference, compared to average temperatures recorded between 1970 and 1999
-
The brown shading shows the range of temperature anomalies
-
Since 1960 mean annual temperature has increased by 0.64°C – around 0.14° C per decade
-
Observed temperature increases have been more rapid over the larger western islands in the west of Indonesia
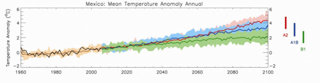
How did Mexico's temperature change between 1960 and 2009?
McSweeney, C., New, M. and Lizcano, G. (2008) UNDP Climate Change Country Profiles: Mexico. Oxford University School of Geography and Environment and the Tyndall Centre for Climate Change Research p9
-
The black line shows the actual temperature anomaly for each year from 1960 to 2000. This is the difference in temperature between the year’s recorded temperature and the average of all years between 1970 and 1999. If the anomaly is positive, that year was warmer than the 1970-1999 average. If it is negative, that year was colder than the 1970-1999 average
-
The brown line shows past temperature anomalies as produced by a computer model with the brown shading showing the range of temperatures produced by the model
-
Since 1960, average annual temperature has increased by 0.6°C – that’s a rate of about 0.13°C per decade
How did the UK's temperature change between 1960 and 2009?
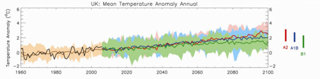
McSweeney, C., New, M. and Lizcano, G. (2009) Climate Change Country Profiles - UK. Oxford University School of Geography and Environment and the Tyndall Centre for Climate Change Research. Report commissioned by the British Council, RMetS, RGS-IBG for Climate 4 Classrooms
-
The black line shows the actual temperature anomaly for each year from 1960 to 2000. This is the difference in temperature between the year’s recorded temperature and the average of all years between 1970 and 1999. If the anomaly is positive, that year was warmer than the 1970-1999 average. If it is negative, that year was colder than the 1970-1999 average
-
The brown line shows past temperature anomalies as produced by a computer model with the brown shading showing the range of temperatures produced by the model
-
Since 1960 the average temperature has increased by 0.9°C – a rate of 0.20°C per decade
-
The green, blue and red lines show projected future temperatures from 2006 to 2100, according to three different emission scenarios – green (low), blue (medium) and red (high). The shading around each line shows the range of temperature that might be possible with each emission scenario
-
All scenarios show future temperatures will be warmer
-
Average annual temperature is expected to increase by 0.4 to 2.4°Cby the 2060s, and 0.6 to 3.2°C by the 2090s
Why can we not be sure what happened in the past?
To know what was happening before 1850, we have to rely on what things like tree rings, fossils, and the gases trapped in ice cores tell us about local temperatures. This information is much less precise, and much less global, than for example the satellite data we have nowadays.
There is no single thermometer measuring the global tempera ture. Instead, individual thermometer measurements taken every day at several thousand stations over the land areas of the world are combined with thousands more measurements of sea surface temperature taken from ships moving over the oceans. These produce an estimate of global average temperature every month.
It is now possible to use these measurements from 1850 to the present, and although coverage is much less than global in the second half of the 19th century, it is much better after 1957 when measurements began in Antarctica, and best after about 1980, when satellite measurements began.
File nameFiles
File type
Size
Download