Lesson two: Data analysis
Key question
How can qualitative data be collected, presented and analysed?
Aim: To understand the data collecting methods Paul and Tanzin used during their trip along The Chadar to Zanskar, including the:
Collection of audio data
Presentation and analysis of data via photo annotation
Starter
Go through the PowerPoint about research methods. The PowerPoint discusses the following questions with the class, see if you can answer them:
-
What is qualitative data and what is quantitative data? Can you give examples?
-
What are the benefits of each data types?
-
What type of data was collected on this fieldtrip?
-
What challenges in collecting data do you think researchers face during a trek through this type of environment?
You will be collecting, presenting and analysing the data they collected for the remainder of the lesson.
Main Activity
Listen to the three audio recordings from Tanzin and Paul’s trip and answer the following questions:
-
What are the benefits of an audio recording?
-
What are the challenges of an audio recording?
-
What sort of information does it provide?
-
Clip one: cave description
-
Clip two: Ice noise
-
Clip three: Inside prayer room
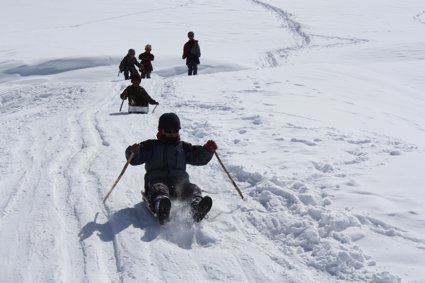
Using one of the images from lesson one, perform some photo analysis of the photos taken on fieldtrip. Make sure you annotate the photos in detail like this example.
Think about:
-
What can you see?
-
What information can you find out from what you see?
-
What does it mean for the future of adventure tourism?
Plenary
Research summary: What have you found out about Paul and Tanzins trip?
In no more than 50 words summarise what you think Paul and Tanzin found out whilst on their journey.