Fieldwork down your street
Although our streets might not automatically appear to be ideal locations for geographical fieldwork, there are nonetheless a wide range of activities that can be carried out here.
Students can find out a lot about their local area through investigations that are relevant to them and their lives. Best of all, these activities are cheap and easy to organise, do not require a lot of expensive equipment, and are based in the local area.
Giving the students a photo of the fieldwork site and asking them to think about what questions they could ask about the area is a good place to start when planning a local investigation. It also gives the students a sense of ownership, and can result in a range of different investigations within the class, the idea of personalised geographies. Alternatively, you can give the students a hypothesis without telling them what attributes to measure, or tell them what to measure but let them come up with the hypothesis. Either way, you are handing the planning of the project over to them.
Some questions that might arise are:
-
Who is the park for?
-
How does it compare with other parks in the area?
-
How has it changed over time?
-
Would the park achieve Green Flag status? (this can be checked against the criteria given on the Green Flag Award website)
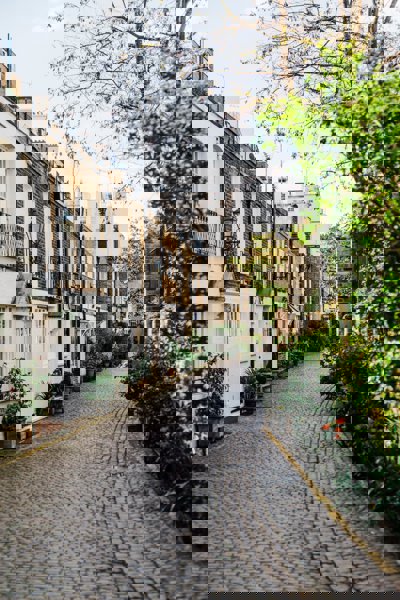
A street of housing, which can be found in many locations across the country, can even raise issues for geographical investigation:
-
Who lives here?
-
Would you like to live here?
-
Why are there speed bumps here?
-
Do the speed bumps work?
-
What speed to the cars travel at?
-
How could this area be improved?
-
Is there much crime here?
-
Do people feel safe here?
How can these issues be investigated?
Students can use environmental quality assessments. Scoring the environment against a range of criteria allows numerical comparisons to be made between sites. However, rather than scoring the area, students could take digital photos to represent the different ends of the scale, or use adjectives to describe the environment of the area and how it makes them feel.
To answer the question, Who lives here?, students can collect direct data in the form of questionnaires, but house to house surveys are not appropriate and residential areas can be very quiet during the day time.
As a result, indirect data is often more appropriate, for example, the use of census data. The Neighbourhood Statistics website is a great resource for finding out about the people who live in an area: age structure, employment levels, number of dependents, household structure, occupation, ethnicity, health... and the list goes on. Information is available down to the Super Output Area level, which in urban areas includes just a few streets.
Indirect data giving an indication of people's wealth and status can also be obtained through studies of property value and upkeep. The House Prices website allows you to carry out a postcode search of the UK Land Registry to find the value of properties sold in the area since 2000.
Can cars be used as an indicator of affluence?
A survey of the age and type of cars parked in the road can be used to generate an average car price for the street using the Autotrader website. However, other questions need to be asked. Perhaps this road is used as parking space by commuters travelling from a nearby station? What else might influence the type of car people drive?
Why are the speed bumps here, and do they work?
These questions can be answered by comparing two similar streets: one with traffic calming measures and one without. Measure a known distance along a street (50 or 100 metres), and time how long it takes vehicles to travel this distance. Speed can be calculated using the following equation:
Speed = Distance ÷ Time
Speeds can be compared between the two streets to find out why traffic calming measures might be needed, and whether or not they are successful in reducing the speed of vehicles.
What types of vehicles use this street?
A survey of the type of vehicles using a street can tell you a lot about the area:
-
Is it a main thoroughfare?
-
Do public transport vehicle routes use this street?
-
Is it a quiet street?
-
Are the vehicles mainly commercial or private?
-
Is it a rat run?
-
Is there a school nearby making it busy at certain times of day?
How can data be collected?
Traditionally, a local area study involved the use of questionnaires, tick boxes and counting surveys. Alternatives could be digital cameras, video and field sketching.
Students should keep a record of the photos they take and what they show. For photos to be meaningful in fieldwork investigations, they need to be analysed and annotated.
Video can be used for reportage - discussing thoughts and feelings about an area or sharing findings with the class.
Rather than just drawing a sketch of an area, students can complete partial drawings or photos, or emphasise particular points and themes: just the traffic calming measures, or just the different housing types. Sketches can be annotated with evidence: what suggests that this is an affluent area? Or annotated with changes that might take place in the next 10, 100 or 1000 years.
The Geograph website aims to collect geographically representative photos and information for every square kilometre in the country. Students can take photos that they think sum up the area and compare them on this website with what other people think. How do your ideas about the area compare with other people's photos?