Longshore drift investigation
A simple fieldwork investigation to monitor the process of longshore drift along the beach at Swanage
Keith Bartlett, Head of Geography at the Royal Manor Arts College on the Isle of Portland, has designed a simple fieldwork investigation to monitor the process of longshore drift along the beach at Swanage. Students set a hypothesis and then collect, analyse and present data to determine whether their hypothesis is correct. The investigation can be applied in any coastal location where longshore drift operates.
Introduction
The process of longshore drift is significant to the formation of beaches, spits, bars and tombolos. It is also responsible for the distribution of sediment and, at times, pollution along our coastline. GCSE students at Key Stage 4 are taught how the process operates but being able to see the impact of longshore drift takes their understanding to a much higher level.
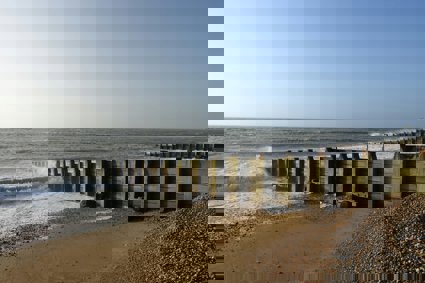
Swanage beach in East Dorset is the perfect location for carrying out a simple fieldwork investigation into the scale of longshore drift operating within a bay. The beach is made up of sand and shingle and it is kept in place by 20 groynes that run out to sea at a 90 degree angle from the coastline. The bay faces east and the beach runs north-south.
Student Preparation
Before visiting a beach, such as that at Swanage, to observe and measure the scale of longshore drift, students must be fully prepared otherwise they will not gain the maximum benefit from this experience. They must be taught how longshore drift operates with the key terms of fetch, swash and backwash introduced and explained.
Many of the best fieldwork investigations start with a simple hypothesis. This hypothesis will be based on established geographical theory and link to a process, landform, issue or problem to be investigated. Students should not expect that they will confirm their hypothesis as long as reasons for rejecting it can be determined if the results indicate that the hypothesis does not stand up to scrutiny. A workable hypothesis in such an investigation is ‘that longshore drift operates along Swanage beach'. By using the word 'that' at the beginning, any statement can be turned into a simple hypothesis (an assertion to be tested).
Collecting the Data
The only equipment required is a recording sheet for each student and a metre rule (or tape measure) with clear one centimetre divisions. Students will need to be briefed in relation to safety: not walking on the groynes, staying out of the swash zone, being aware of other beach users, etc.
Students walk the length of the beach approaching each groyne from either the North side or the South side. At each groyne, students stay above the swash zone and look at the accumulation of sediment on both sides of the groyne. They measure the drop from the top of the groyne to the sediment on both the North and the South sides.
It is possible that longshore drift is dominant from one direction (N-S or S-N) but it is also possible that a variation of results may be obtained.
Processing the Results
Students return to their data sheet and look at the Drop North Side and Drop South Side columns. Whichever column has the smallest drop, that is the direction of longshore drift at that particular groyne. It is now helpful if students add the letter N or S against the number in the Difference column to indicate whether drift is from the North or the South.
The results can now be graphed very effectively:
Graph one - click to enlarge
The results from the Difference column, in cm, are drawn as bars to the correct level above or below the box of the groyne to which they refer. Patterns in drift rapidly become apparent.
Interpreting the Results
Patterns should be evident within the graph drawn to display the longshore drift results. These can be described to identify the dominant direction of drift and reasons suggested for those results. These reasons should relate to most recent wind directions that influence the fetch affecting wave activity along the beach.
Students should then look back to their hypothesis and answer the following questions:
-
Was the hypothesis correct?
-
What was the dominant direction of drift?
-
Why was this the case?
Evaluation
Students may now reflect upon the following features of their investigation:
-
Was the hypothesis a good place to start?
-
Did the data collection method work?
-
Did they collect results that they could use?
-
Were there any problems with the method?
-
Did these problems affect the accuracy of the results?
-
How much these problems influence the conclusion?
-
If they repeated the investigation at a different time of year, would they get the same results?
-
Would changes in results change their conclusion?
-
How might such an investigation be improved in the future?
Extension
Students might add a fifth column to their data capture sheets to record the beach materials present at each measuring point. These can then be added to the graph by means of a colour, for example sand could be yellow, small stones could be green, larger stones could be red. Now the pattern of drift might link to the type of beach sediment present.