Changing maps
What processes have changed London, and how have maps themselves changed?
Starter
Show the meander at the start of EastEnders – could people identify the city from there?
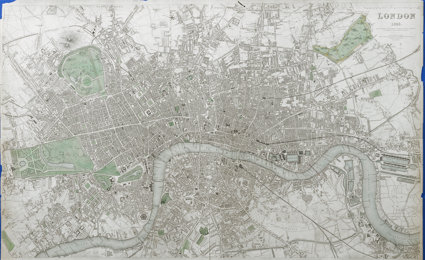
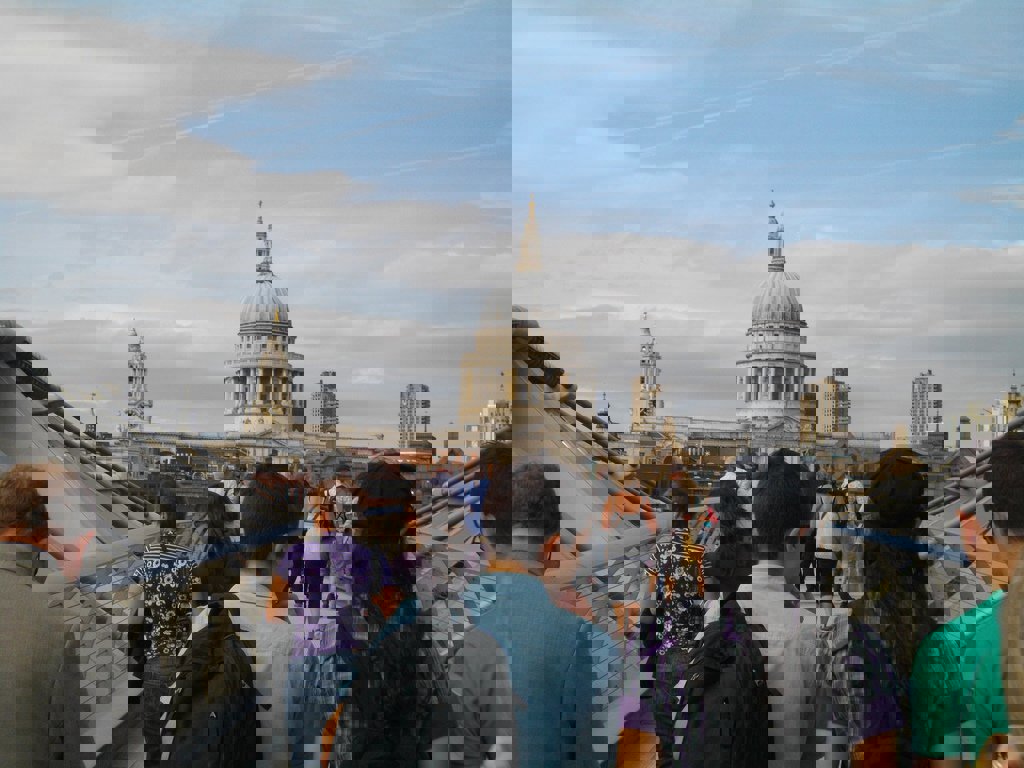
Is the River Thames the most recognisable feature of any London map?
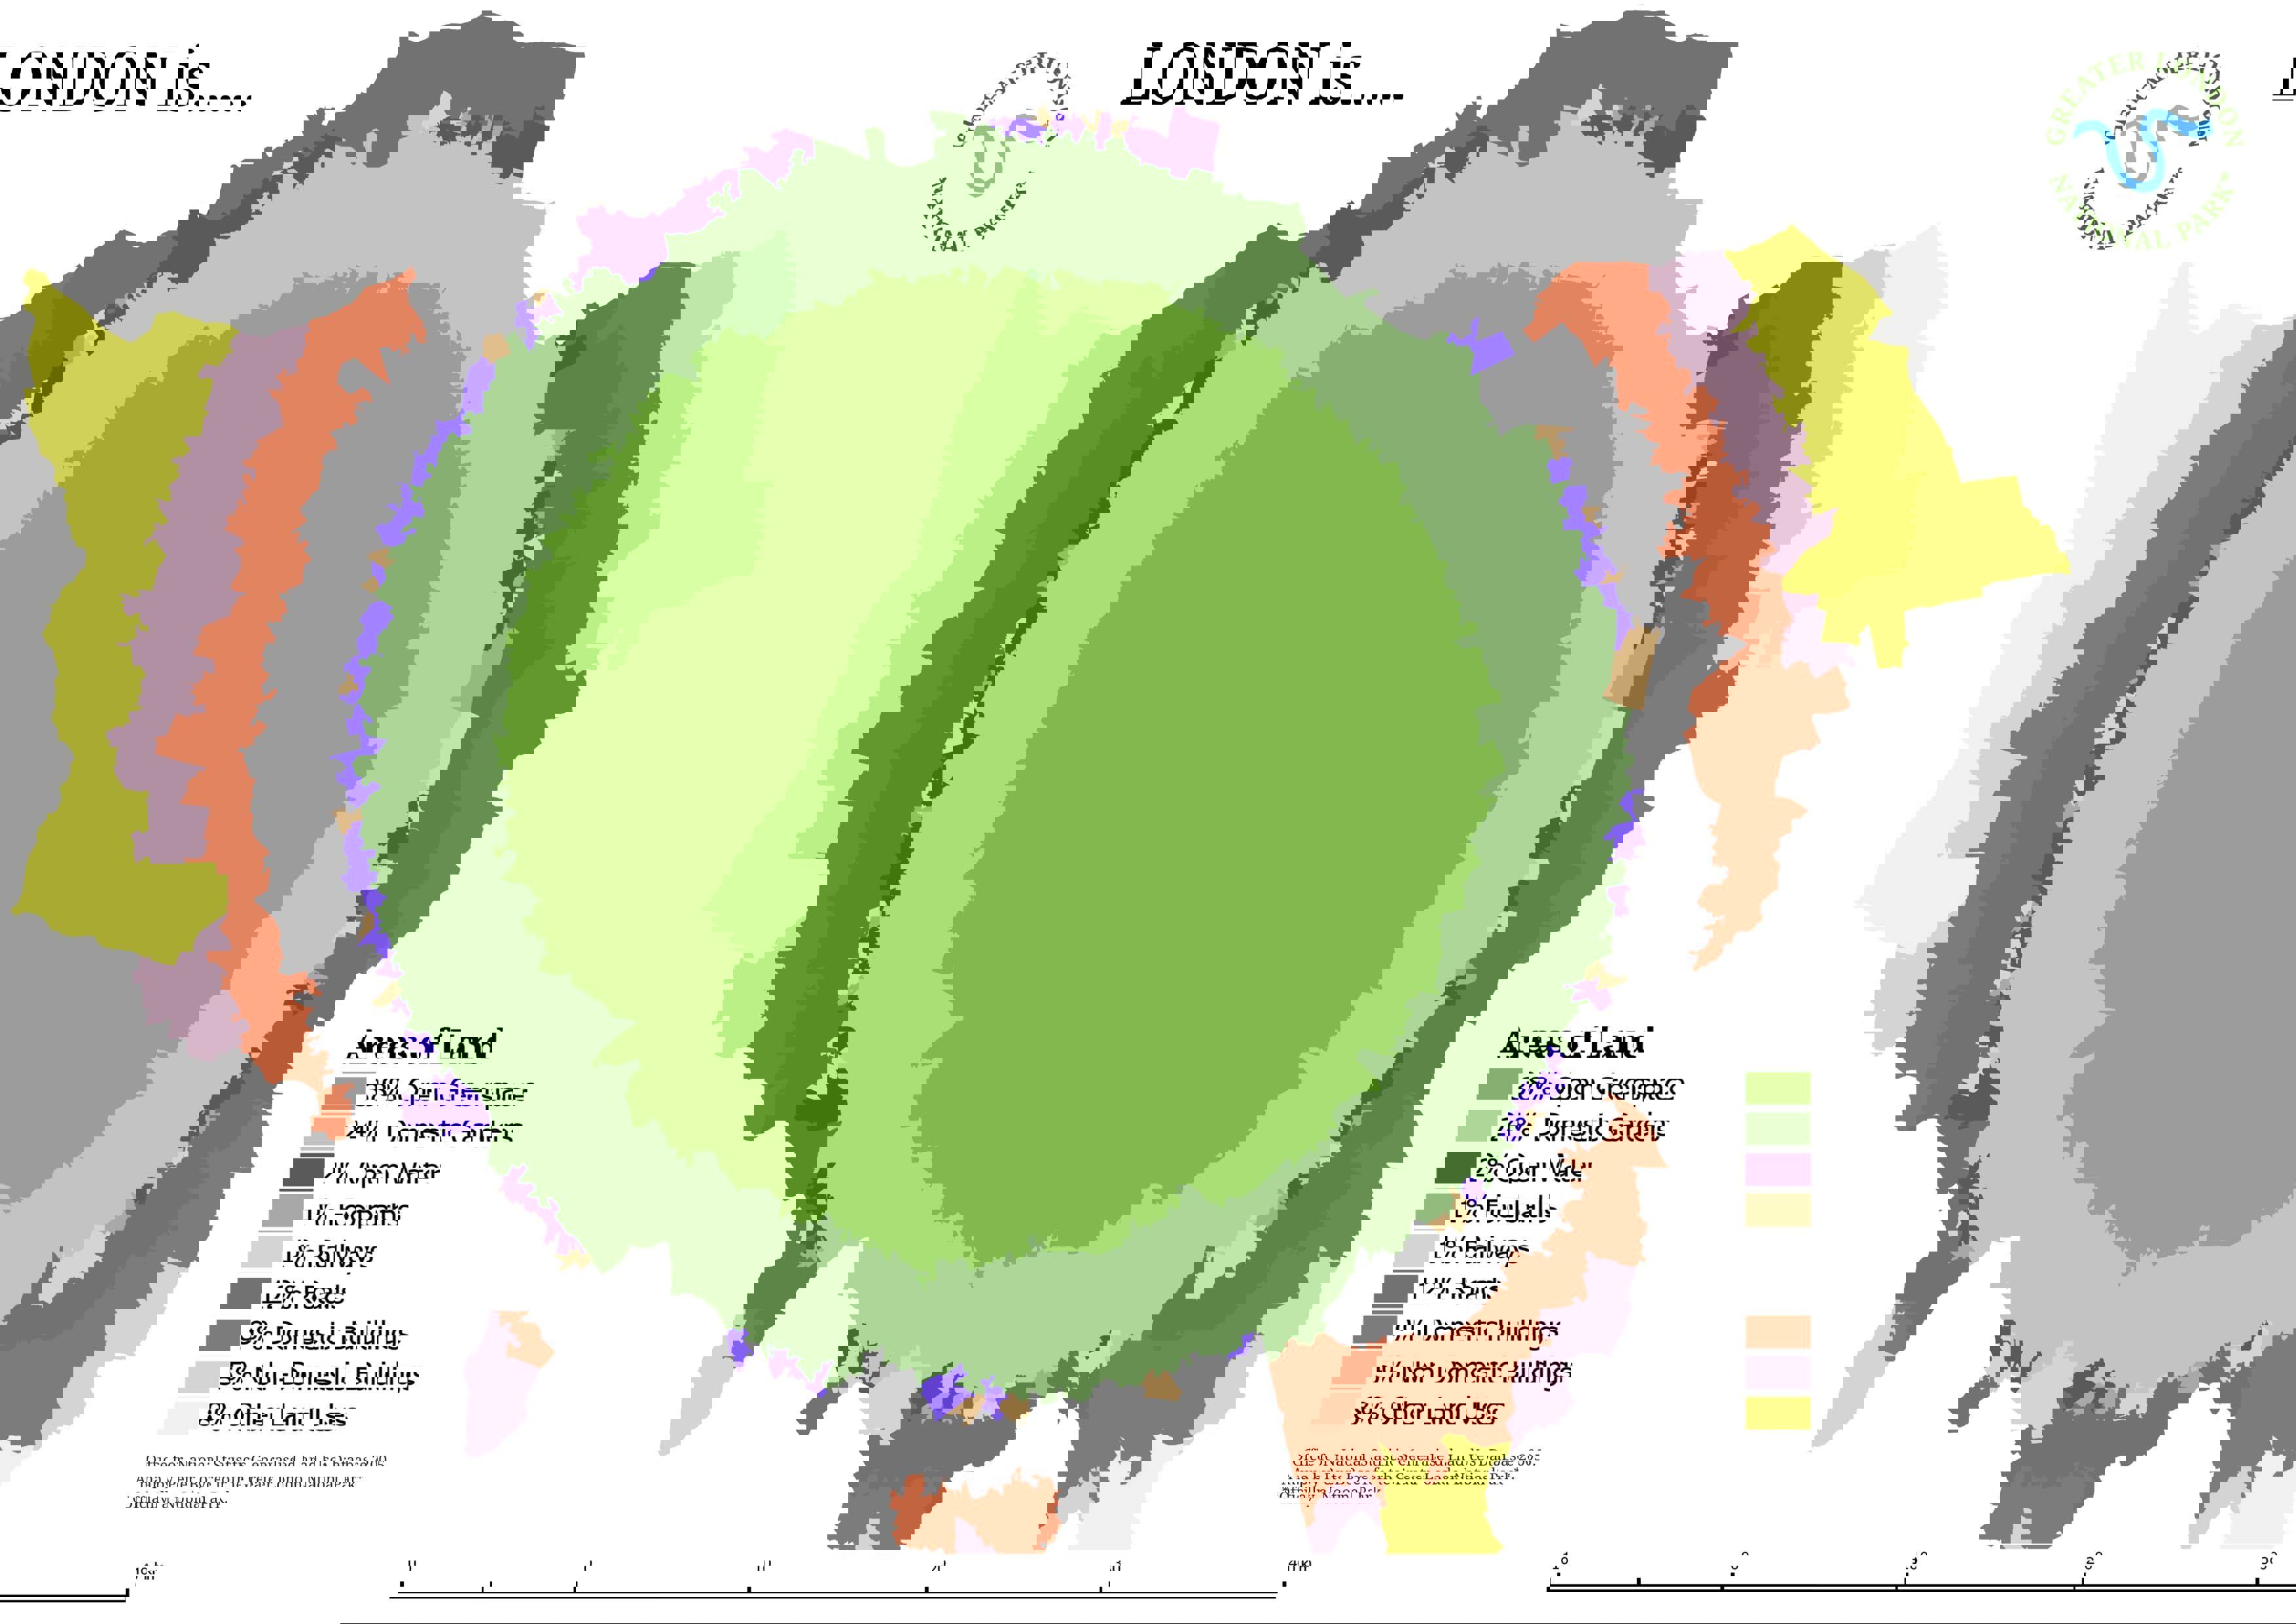
What do they think makes up the majority of the city of London? Collect answers then show the Land use in London image.
Carry out an image search using an internet search engine on the term: ‘London Maps’ and explore the different variations in the first 50 (or if time permits 100) maps – what are the ‘constant features’ that are in most of them? Use the Image search sheet to collate these.
Groups of students could be asked to use a different search engine, as they will not all show the same images. Are there some which provide a better range of results from this search?
Main Activity
Some key changes
London’s map has changed over the years – let us take a look at some of the processes that have led to change in the city.
Have a look at the maps within this article.
Discussion point:
Can you suggest times when London’s map might have changed significantly based on the work done so far?
Introduce students to two key events that changed London in the past:
Great Fire of London, 1666 – and Sir Christopher Wren’s plans to rebuild the city
The Blitz, 1940-1 – and the Abercrombie Plan to rebuild the city
In 1666, the River Thames reflected the flickering glow of fires during the Great Fire, and during World War II, the familiar shapes of London’s river were used by German bombing crews attacking London to identify their targets
For the latter, go to Bombsight website
Discuss the impact of the Blitz on London – changing landuse and infill of the city following the removal of areas by bombing, and the persistence of many of the bomb sites for decades after the war.
Two more recent changes:
The Development of the London Docklands area: 1981 to present
The Queen Elizabeth Olympic Park: 2004 to present. Visit the Queen Elizabeth Olympic Park website
Students are asked to produce a brief report, including at least one map, to describe the changes that have taken place as a result of their chosen (or allocated) event.
Plenary
Changing London: debate over whether the pace of change in London is too fast. Is change always good in a city?
Identify some changes which they feel have not been improvements (perhaps with reference to their own home area if they feel they are not familiar enough with London yet to have an opinion)
Extension activities
Use StreetView to visit the Memorial and Pudding Lane
An interesting project recently overlaid historical images onto the present day London streets. Go to the Telegraph website
You can also use this website to hide all the roads in London, for example to see how they dominate the city. Go to the Styled Maps website
File nameFiles
File type
Size
Download