Starter
Show a Street View scene of Trafalgar Square, or some other iconic London location.
You can see what is going on here, but what is missing from the experience of being there?
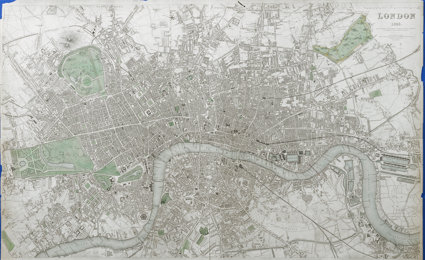
Could this place be fully represented in a map?
What does London taste like?
Explain that some people are synaesthetic. What does that mean?
It means that they have a particular sensory awareness that is heightened, and makes them experience the world slightly differently to other people.
One such person has produced a map of what each of the London Underground stations on the networks taste like. Go to the BBC website
What does London sound like?
This is easier perhaps. You can listen to some sounds suggested by users on the SoundMaps here. Go to the Sound Survey website.
Students could add to the map by downloading the iSAY app from the University of Salford’s Sound Around You project.
This already has lots of user-generated contributions.
Challenge students to suggest what might go into a sensory map for London.
Use the SensoryLondon document to record ideas for what London might ‘sound’, ‘feel’, ‘taste’, ‘smell’ and ‘look’ like.
Main Activity
Students should be presented with one ‘alternative’ look at London. These can be sourced from the Mapping London site. The following are suggested data visualisations:
Data and visualisations from the Office for National Statistics (ONS) also explore such things as well-being. For example, how does London compare with the rest of the UK?
 Remember the Pinterest board for examples of other ‘maps’ that could be referred to.
Ask students to suggest elements of life in London which could be used to create a new ‘map’ of the city incorporating elements of sensory ideas, thoughts or feelings. They should then search to see whether someone has already had the same idea.
Produce some group ideas for a map which uses numbers, images or other details to tell the story of a place in London more thoroughly than existing maps.
How might technology help with this?
Plenary
Show students the representation of London in the RGS-IBG’s Hidden Journeys project. This is a reminder that the city also extends upwards and downwards from the space it occupies on the ground. Go to the Hidden Journeys website
Can students make sure their map is 3D rather than just 2D?
File nameFiles
File type
Size
Download