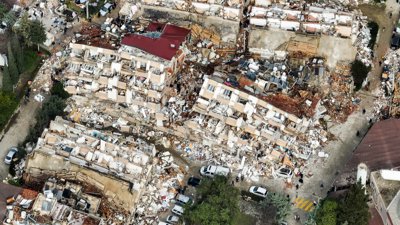
Human population is growing by over 80 million a year, and is projected to reach the 10 billion mark within 50 year. How can high resolution mapping support the burgeoning resource and environmental challenges of global development and population?
Andrew Tatem, Professor of Geography at the University of Southampton and Director of the World Pop project discusses quantifying population movements and data skills in geography.
You can follow Andy on Twitter at: @AndyTatem
Lesson Ideas
On April 25, 2015, a 7.8 magnitude earthquake struck Nepal killing more than 9,000 people, injuring many more and leaving nearly 3 million homeless. Ask students to produce a fact file on what happened, using the resources below. Ask them to consider. What are the data challenges this situation might pose for families affected, government and international aid workers seeking to provide help?
Nepal earthquake: Hundreds die, many feared trapped (BBC, 2015)
Earthquake rocks Nepal – as it happens (BBC, 2015)
Using data produced by FlowMinder and shared on World Pop discuss the patterns of movement by people following the earthquake. What does the data show? What are the flows of people? Add this to the fact file produced at the beginning of the lesson.
As a group discuss: why might this data be incomplete? Whose movements may not be recorded and why?
Links
-
Filling global population data gaps: an interview with Andy Tatem
-
Natural disasters put Haiti and Philippines on the map (2013) The Conversation
-
Mobilising the data revolution to achieve sustainable energy for all (2017) World Bank
Data
Andrew was interviewed in December 2016.
Key Words
High resolution mapping
The presentation of spatial data to a detailed scale and scope
Population displacement
The displacement of people refers to the forced movement of people caused by factors such as natural disasters, famine, diseases, or conflict. This causes direct displacement: actual movement of people from their locations, and indirect displacement which leads to loss of livelihood forcing people to move.
Open data
This is data that anybody can access, use and share.


