Is our local area a risky place?
Looking at neighbourhood and local statistics, pupils compare the level of risk compared to regional of national figures in terms of crime and other risks
This lesson focuses on the local area. The students may already have personal experiences which they are able to discuss or map.
Key questions
What is risk?
Is our local area a risky place?
What is risk?
A risk is a situation involving exposure to danger or the possibility that something unpleasant will happen.
Is our local area a risky place?
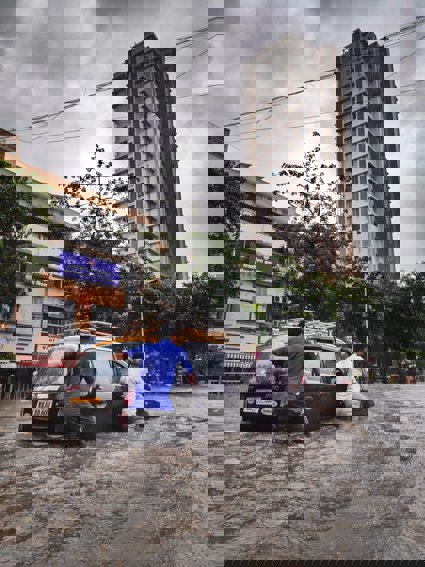
Relating to the local area should help students engage more directly with the work. Firstly local risks should be identified. Local resources can be used such as local newspaper reports, personal experience and interviewing local retailers or neighbours. Photos can be taken of the riskiest places in the local area. Students can give descriptions and explanations that link local features (human and physical) with risk. This can be an interesting exercise as local people know more then any outsider about their community but often assume they know everything about their local area.
Students might focus on crime as the major human risk that affects quality of life and life expectancy in the UK but attention should be drawn to some of the other risks associated with deprivation.
A snapshot of crime recently showed that in England and Wales more than 16,500 crimes are reported each day - one every five seconds. In contrast, more than 5,400 people were arrested each day - that's one every 15 seconds. Although these figures may at first appear high, the long term picture is an improving one. Crime in many countries with a high level of development is actually falling. In the United States, for example, the 2005 violent crime rates were less than half those of the peak year, 1994. England and Wales experienced a 44% drop in all forms of crime between 1995 (when crime peaked) and 2006
Links
Starter
What is risk? What does it mean to you?
Write a definition of ‘risk' or rearrange the words on the definition of risk sheet to make a definition.
Main Activity
What is it like in our local area? How does it compare with the wider area, or the country as a whole?
Go to the UK National Statistics website.
-
Select ‘neighbourhood' at the top of the page
-
Look at the right-hand side of the screen. Type in your postcode
-
Study the data generated
-
Write a sentence to describe each chart
-
You could also add a sentence to explain whether the statistics shown fit with what you know about your local area
Go back to the ‘neighbourhood' page.
-
Look at the left-hand side of the screen. Type in your postcode then select ‘Ward'. Press search
-
Select ‘Crime and Safety' then ‘Key Figures for Crime and Safety'
-
Complete the matrix. These figures will be used for a class discussion in the final part of this lesson
What other risks are there in your local area? How do figures compare with the regional and national scale?
Write a paragraph to describe the level of risk in your own local area.
Look at some other areas and compare the Key Figures for Crime and Safety.
File nameFiles
File type
Size
Download