Lesson two: Data analysis
Key questions
What type of data did the researchers collect in the field?
Why do the researchers use different instruments to collect their volcanic gas data?
What does volcanic plume analysis tell us about the activity of the volcano?
How could plume analysis help determine a future volcanic hazard?
Aims
The aim of this lesson is to understand the field methods used in volcanic plume analysis by researchers at graduate level and above.
This lesson will also help you interpret data collected in graphical form and use this information to help you prove a set hypothesis.
Starter
Read the introduction to field methods used for each volcano on the field instruments task sheet. Using the Instrument resource sheet, match up three sentences for each method and one photograph.
This will help you understand what the different instruments were used for and a brief account of why the data was collected.
Main Activity
In this part of the lesson you will study some of the data collected from the volcanic plumes at the different volcanoes and try to analyse the data to help you answer a hypotheses. This is similar to the techniques undertaken in fieldwork reports or controlled assessment/coursework tasks.
You may wish to read this link to Oregon State University website (as further reading) which gives a comprehensive account of measuring gas from volcanic eruptions.
UV Spectrometer values at Lascar
The UV Spectrometer at Lascar was used to collect SO2 column amounts values in the plume cloud of the volcano. To do this the UV Spectrometer was set up on a rotating stand between 50◦ and 130◦ bearing.
Look at the images of the scanning device in the Scanning Instruments resource to see how the scanning data was collected. Now look at the excel data, SO2 column amounts from three horizontal scans at Lascar.
Use the graphical information to plot a line graph of the SO2 values for three scans across the Lascar volcanic plume.
The data you have plotted should resemble the SO2 plot prepared by the scientists (see figure of SO2 plot from different scans). Using the data analyse the following statement:
“The SO2 column amounts from the UV spectrometer scans reflect the relative position of the volcanic plume.”
Based on the information you have acquired so far in this lesson, consider the following questions.
-
Why do you think that the graph shown in the figure is represented by a range of values at each scan angle?
-
How important a measurement is SO2 as a method for detecting volcanic activity?
-
Why would it be important to gain data on a range of SO2 values from plumes of varying size?
-
How useful is plume analysis using a UV spectrometer in potentially detecting a volcanic hazard?
Plenary
Collecting data in a volcanic environment is often hostile to the equipment being used. As a result, only at Villarrica was it possible to collect data from each instrument. It is necessary to evaluate your field methods.
Read the following exerts from the research team fieldwork report on collecting good data from the Puyehue-Cordon Caulle and Lascar volcanoes:
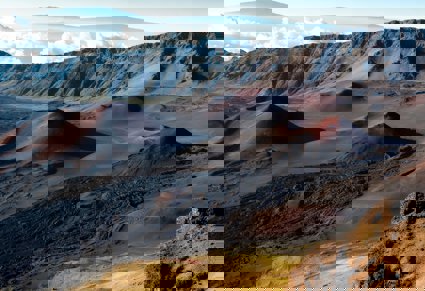
Puyehue-Cordon Caulle
On 29 February, we attempted measurements of the recently developed ash-rich plume at Puyehue-Cordon Caulle volcano. Because of the high ash content of the plume, however, most of our instruments were unable to gather any accurate data. HD video of the plume was recorded for approximately one hour, until the camera was destroyed by high velocity wind-blown ash particles entering the instrument. Lava samples were also collected from the recent and still growing lava flows for chemical analysis.
Lascar
Challenging field conditions at Lascar precipitated the unfortunate death of our UV camera and filter pack instruments. This limited our monitoring capacities during the field period spanning from the 24 to the 29 of February.
What are the problems of producing worthwhile data sets on volcanoes?
What impact could this have on the researchers?