Geovisualisation
Discover how geographers bring a unique perspective to presenting data in innovative and understandable ways.
Find a geovis
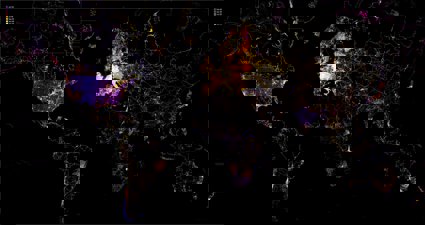
AI within a geospatial context
Steve Attewell has created an experimental map control system that uses hand gestures, voice recognition and artificial intelligence.
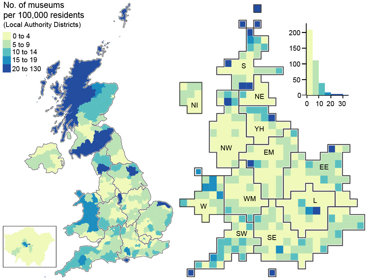
Mapping museums
Andrea Ballatore and Fiona Candlin used visualisations to better understand the spatial unevenness of the cultural sector across the UK.
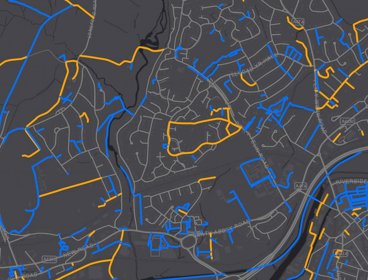
Mapping unadopted roads in Wales
GeoPlace created this visualisation, which was commissioned by the Welsh government, showing the network of unadopted roads in Wales.

Early-warning monitoring for bridges using SAR
Emily Selwood, Software Engineer at the Satellite Applications Catapult, created this visualisation which is intended to act as an early warning system for bridge deteriorations.

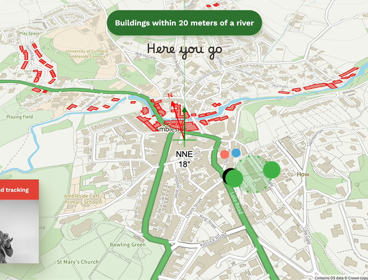
Urban cycling
Robin Lovelace explains how and why he created this interactive map-based web tool to help identify promising locations for new cycleways in England
Geography has never been more important in helping us to understand our rapidly changing world.
Geographers bring a critical perspective and approach to interpreting and presenting data. They help make new connections between different types of data by interweaving spatial methods with knowledge about our world, and finding innovative and understandable ways to present it.
In this series of images, we look at the power of maps and geographical data visualisations for telling stories about our world. We explore the ways in which connecting data on people, places and environments underpins good decision-making and improves communication and understanding. In the interviews with the creators that accompany each image, we showcase the skills, data, techniques and tools used to tell these stories, and the insight they can bring.
If you would like to suggest an image for the series, or would like to take part, get in touch at policy@rgs.org.