
Alasdair Rae, Professorial Fellow at the University of Sheffield, created a visualisation showing the link between voting patterns and levels of deprivation in the UK after the 2019 general election.
Explainer
Here Alasdair explains why he created the visualisation, the methods he used and the impact it has had in wider contexts.
What story does this visualisation tell?
I think the story that this chart tells us is that what we think we know about the link between voting patterns and levels of deprivation in the UK is largely true. Of course it masks some nuance and subtlety, as I explained in a comment piece on an earlier version of the graphic. Yet I am often reminded that the kinds of things I think are 'normal' or 'obvious' are not at all. Most people, it's true, do not spend most of their days looking at data, charts and maps so this kind of graphic can actually be quite a revelation to some people, even if it does kind of confirm what they might have expected.
Why did I create it? If you look back through my statsmapsnpix.com blog, you'll see a post from June 2017 where the first version of this graphic appeared. It is at the bottom of the page, as kind of an afterthought - because that's what it was. I cobbled it together in a very rough way at the end of the day at work before heading out to catch the tram, and I added the following caption "the pattern is to be expected, but quite interesting". I was initially sharing the visualisation to the audience of my blog. I get about 10,000-15,000 page views a month with a few thousand unique users, most likely spread across academia, policy, geography teachers, and the like - the kind of people who are into the stuff I am into. So it was intended for anyone with an interest in my blog, which is all about stats, maps and graphics.
In short, the answer is that I created it out of curiosity, to see what the visual pattern would look like in chart form. I was trying to learn something.
What data methods and tools did you use to create it and why?
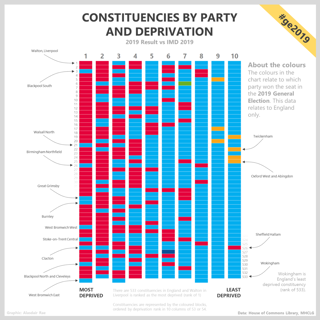
I used Excel. I admit it. If I had thought people would be interested in it and that it would have become a bit of hot chart on Twitter I might have gone all fancy and done it another way, but it was a quick and dirty end of the day experiment using Excel and a bit of conditional formatting. I took the constituency deprivation data compiled by the excellent team at the House of Commons Library and then split the 533 English constituencies into 10 slightly unequal columns, ranked from most deprived (top left) to least deprived (bottom right), then coloured them using the party colours we all know.
I also shared an animated version of the chart which loops through 2001, 2017 and 2019. In this you can see something of the crumbling of the so-called 'red wall' - in that the 2001 version has the first three columns as solid red, with one single Liberal Democrat block. By 2019, this red wall has taken on much more of a blue hue. The fact that my chart is comprised of brick shapes perhaps fits the 'wall' narrative quite well so that may have helped with engagement, but it wasn't intentional.
If I had given it more than a moment's thought I may have done it using fancier tools, but it was just about quickly turning an idea into a graphic.
How has the visualisation had an impact in research, policy or other contexts?
There was quite a bit of interest in the graphic, which is in part I think due to the fact that we've had so many elections and polls in recent years. So, it somehow capitalised upon the zeitgeist and possibly even fed into it. Well, maybe.
Different organisations and individuals have subsequently done their own versions, or similar, including the Resolution Foundation, The Economist, Sky News, the House of Commons Library team, and many others on Twitter. I think it struck a chord with many people and all-in-all it had over 900,000 impressions on Twitter and was shared by many big accounts, including Faisal Islam at the BBC.
How have people engaged with the visualisation?
To be honest, it set off all sorts of Twitter comments, far too many to keep up with - and particularly when people started lifting the graphic without attribution and adding their own takes to it. I don't necessarily have a problem with this but it makes it more difficult to understand what people make of it.
Some people said things like, “this proves that Labour aren't the party of the metropolitan elite”, while others said things like “voting Labour obviously makes you poor”. But of course I would caution anyone against thinking this graphic says anything at all about causal links. It identifies some broad-brush relationships that we might have reasonably expected to exist but in chart form, with familiar colours.
I do know that the graphic was used widely and referred to across the political spectrum, from Westminster to town halls and beyond but it certainly isn't politically motivated. I was trying to see if there were patterns and, more importantly, what they looked like.
Try it yourself
This type of visualisation is ideal where rank and colour are key components of what you're trying to understand.
Alasdair suggests taking some ranked data in Excel, copying and pasting it into 10 separate columns, and using conditional formatting to colour it. Alternatively, get in touch with Alasdair directly and he is more than happy to share the spreadsheet he used to put this together.
Alasdair liked that the Resolution Foundation did the visualisation differently, because they took the colour and order idea but instead of using deprivation they used age, and the pattern was fascinating.
If you want to do something more complex, and more easily modifiable from scratch, you could do it in R just like The Economist team did with theirs. But in this case Alasdair thinks Excel works fine.
About the creator
Alasdair Rae is a Professorial Fellow in the Department of Urban Studies and Planning at the University of Sheffield.
His research encompasses neighbourhoods, cities, regions and anything in between, specifically using data and maps. Recent projects have included understanding the link between online housing market search and future market activity, understanding patterns of geographical inequality at a local level within England, and the economic geography of the United States.
You can find out more about Alasdair’s work on his blog and website, or follow him on Twitter.