The Elizabeth line, Crossrail
The specification
AQA A Level 3.2.1.1. Factors in globalisation: the development of technologies, systems and relationships, including financial, transport, security, communications, management and information systems and trade agreements.
Edexcel A Level Topic 3 Globalisation. 3.1 Globalisation is a long-standing process which has accelerated because of rapid developments in transport, communications and businesses.
OCR A Level Topic 2.2 – Global Connections. 2.a. Access to markets are influenced by a multitude of interrelated factors.
WJEC A Level 3.2: Global Governance: Change and Challenges. 3.2.1 Globalisation, migration and a shrinking world. Transport, communication and media representation.
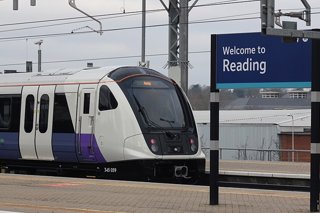
Figure 1 a new Elizabeth line London Underground train departs from Reading © Geof Sheppard Wikimedia
Why does London need a new line?
London is both a world city and a mega city. It is a world city owing to its economic and political importance on the world stage, and due to its location on the edge of Europe. London has “megacity” status due to a population of over 10 million inhabitants. Whilst the official city boundary only holds 9.1 million, there are, in fact, 25 million people in the “urban agglomeration” that stretches across southeast England. (Data analysis by Savills identifies this area by proving that house price movements across large parts of southern England are correlated with price movements in the London market. This is also evident from commuting data).
Economically it is the capital city of a G7 country – the UK is the fifth largest economy in the world. It is widely reported that London accounts for approximately ¼ of the country’s total GDP. Another articulation of London’s economic dominance is that the region now accounts for £4 in £10 of total UK economy. After the UK population voted to leave the European Union in 2016, London lost its standing as the financial centre of the world (to New York). It remains, however, the second biggest and is still ahead of European rivals, dominating foreign exchange and derivatives.
London is an international hub with city life woven into the global economy. Out of the 500 TNCs (transnational companies) located in the UK, 271 have their headquarters in London and a further 28% are found along the M4 corridor. 90% of all UK business services are located in the southeast.
The city is also a centre for national and regional politics. Both the Houses (of a two-House system: the House of Commons, and the House of Lords) are located in the London borough of Westminster. Here politicians and Lords debate current issues, make laws, and scrutinise the work of the UK government.
London’s population is expected to continue to grow, albeit modesty, throughout the twenty-first century. Although consultants PwC estimate a 300,000 person decline at the end of 2021 due to COVID-19, the GLA (Greater London Authority) project a return to population growth of around 50-70,000 people per year (a slower rate). This will lead to a population of 11 million Londoners by mid-century.
The Elizabeth line
The Elizabeth Line is the newly named Crossrail project. It is a landmark project as London Underground S7 and S8 Stock passenger trains, which currently only run on the District and Metropolitan, will now run through the city centre, going as far out as Reading, in Berkshire, and Shenfield, Essex. In total an additional 42 kilometres of track will be added increasing rail capacity by a substantial 10% in the city. Each train will be 9 carriages long, with space for up to 1,500 passengers. It is described as the biggest infrastructure project in a generation. The route map as of May 2022 is shown in Figure 2.
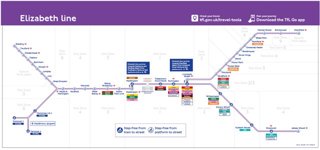
Figure 2 Phase 1 of the Elizabeth line © TFL
The summary facts of the new transport line are:
-
Crossrail was first proposed as an idea in the London Rail Study of 1974
-
UK government initially gave the go-ahead to develop east-west Crossrail in October 1990
-
It is a £19 billion “megaproject”
-
It is London’s first fully accessible tube-railway
-
There will be 41 step-free platforms
-
10 new stations have been built from scratch, some described as “subterranean cathedrals”
-
8 artists were commissioned to produce designs for the new stations
-
New platforms are 249m long to accommodate 200m-long trains
-
Trains will run with 9 carriages and a capacity of 1,500 passengers
-
26 miles (42 kilometres) of new tracks have been created
-
The first phase opened 24 May 2022 with 12 trains per hour
-
The line is expected to carry 130-170 million passengers a year by 2026
-
It brings the capital’s 4 airports together with just one interchange
-
It is the first 100% digital railway in the world
-
Paddington station is so big you can fit the Shard in it
-
Noise is kept to a minimum due to “milling” trains (no screeching or loud sounds)
The railway has been designed with future capacity increases in mind, including the ability to run longer trains and more frequent services. The size of the trains and the scale of the project has been made possible by the impressive Crossrail tunnel boring machines.
The Tunnel Boring Machines
The tunneling aspect of the project has been a feat of human engineering, encapsulated by The Times headline “Digging inches from disaster: how they built the Elizabeth Line”. The scale of the project and amount of tunneling (in an already congested subterranean system of water pipes, sewage systems, existing tube lines, ancient burial grounds, and geologically sensitive ground) is highlighted by the vast distances covered in Figure 3.
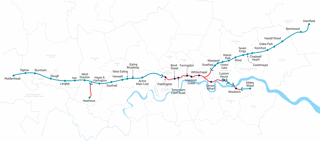
Figure 3 a route map for the Elizabeth line (not including Reading) © Mapping London
Tunnelling began in 2011 with 8 huge Tunnel Boring Machines (TBMs) completing the task in 4 years. These machines, part automated and part operated by skilled engineers, at times passed within 85 cm of the Northern line tunnel. The tunnelling task has been described as “akin to keyhole surgery” especially because normal life in the capital has continued largely undisturbed on the surface.
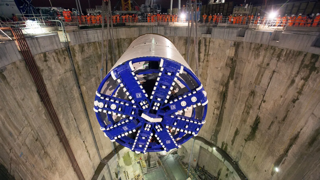
Figure 4 A Crossrail TBM is lowered into the London Underground system to begin drilling © Crossrail
The TBMs are enormous factory-like digging machines which have:
-
Lasers guiding the tunneling machines, with accuracy of 5cm
-
Hydraulic rams pushing against newly laid concrete segments (to move the drill forward)
-
Screw conveyor belts to remove the 7 million tonnes of excavated earth
-
65,000 sensors placed on landmarks throughout the city to monitor vibrations within 100 m
-
A weight of 1,000 tonnes and are 148-metres long, the equivalent to 14 London buses
-
A £10 million cost, purpose-built by German firm Herrenknecht
-
External diameter of 7.1 metres (23ft) and from cutting-face-to-end stretches 150m (500ft)
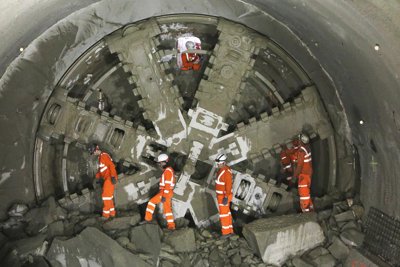
The tunneling phase of the project has received high praise, winning the prestigious Global Tunneling Project of the Year Award (for Bond Street station) in 2015. Whilst first project work began in 2009, tunneling only started in 2012, and finished in May 2015. A remarkably quick timeline. During this period, tunneling involved two TBMs drilling towards one another, at 1 metre per hour, using a laser-guided system. The TBMs, called Victoria and Elizabeth, carefully came to a halt and met one another under Farrington station. Figure 8 shows the moment the two engineering teams met one another.
As the TBMs moved forwards pre-cast concrete segments (weighing 3,000kg each) were ferried along a conveyor toward the front of the machines, where a giant hydraulic arm moved them into place to form a tunnel lining. This, combined with controlling the thrust and speed of the screw conveyor (taking the spoil away from the cutter head), stopped the tunnel from collapsing.
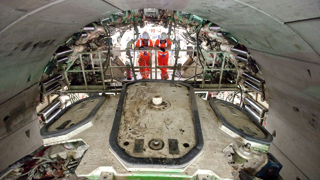
Figure 5 a TBM is a factory-like digging machine © Crossrail
Canary Wharf
Work began in 2009 in the London business district, Canary Wharf, with the first piece of broken ground excavated and first pile inserted into the North Dock. The station is one of the stops on the Elizabeth line, with an estimated cost of £500 million (the exact figure is rumoured to be higher). The Canary Wharf Group partly funded this particular cost with Chief executive Shobi Khan saying:
It’s a game-changer for Canary Wharf. It’s a game-changer for London and I make Canary Wharf as a big winner. It increases our connectivity to Heathrow and [to] East London where all the jobs and growth are. And so, that connectivity and capacity – is outstanding.
Shobi Khan
The station is 18 metres below the water level in the North Dock of West India Quay on the Isle of Dogs. Amazingly, the design has retained a navigable channel for boats within the dock. The investment signals a continuation of support from the UK government to the Canary Wharf Group and the financial district. The station:
-
Consists of 6 storeys
-
Has 100,000 ft2 of retail space and a rooftop park
-
Will dramatically increase the transport capacity to and from Canary Wharf
-
Involved the excavation of 300,000 tonnes of material, and 375,000 tonnes of concrete
The Canary Wharf Group continue to draw ties back to the rich sea-faring history of the Isle of Dogs (throughout the C18 and C19) by the ship-like design of the station itself, and an installation by artist Michal Rovner, depicting human movement through time on a large-scale video. In the video an iconographic London landscape is shown with lines of human figures rapidly moving across it, representing the history of import and export and the modern-day connectivity of train lines to Canary Wharf. Connectivity will significantly improve after the Elizabeth line fully opens. For example, the journey from Canary Wharf to Farringdon will reduce from 24 minutes (and 3 tube trains) to just 10 minutes on 1 Elizabeth Line train.
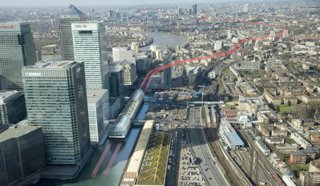
Figure 6 the Canary Wharf station on the Elizabeth line with the route superimposed across London © Crossrail
Urban rail systems
But is the age of mega-investment in urban public transport systems over? Life in 2022 is more uncertain than in recent years with fundamental changes to people’s work patterns, travel habits, and leisure time.
New technologies, such as ride-hailing apps, have disrupted old established ways of travelling and there has been a marked uptick in commuters choosing to walk or cycle to work in London. The new uptake of e-scooters and e-bikes – described as “micro mobility” – has further altered movement across cities.
There has also been a change in commuter behaviour. The knowledge workers who once worked in offices are now based (at least partially) at home or in “third spaces”, such as cafés or co-work buildings. Although once the COVID-19-effect is separated out, the rise in working from home is not as big as it is sometimes assumed to be. It is mostly self-employed people and students who work in third spaces, which has a lot to do with high property prices and high rents in London.
Equally, the new “Deliveroo culture” of shopping has reduced the need for people to use public transport to cross the city to visit restaurants or to buy goods. The rise of e-commerce (e.g., Amazon) means that people travel less frequently to buy particular goods in retail centres, though many still go there to see products, for the experience, and for social purposes.
Even before the pandemic struck in early 2020 a number of cities were seeing a fall in journeys on urban public transport systems. In London, in the years leading up to 2019 passenger journeys fell by 3.5% every year. In 2022, the number of Londoners using public transport is only at 65-70% of pre-COVID-19 levels. Although it is expected that pre-COVID-19 levels will be exceeded again in the next few years, there is concern that a loss of commuters means less ridership and less fares. This is a problem because such declines might force operators to decrease services or increase fares which will drive even more passengers away.
However, urban rail systems are still being built. Paris has invested in an even larger project, called “the Grand Paris Express”, at a cost of more than €30bn, with the majority of similar investments being commissioned in Asia. For example, Beijing, Kuala Lumpur, Shenzhen, and Singapore are all currently building at least one rail project with a value of more than $5 billion. In London, Prime Minister Boris Johnson has signalled support for Crossrail 2 (north-south from Broxbourne in Hertfordshire to Epsom in Surrey) but added the caveat:
We need all the partners to come together and say this is the right thing for our city and here’s how we’re going to do it.
PM Boris Johnson
There are still uncertainties over whether or not Crossrail 2 (shown in Figure 7) will be realised due to project funding. It is a particularly difficult promise to fulfil because costs are widely seen as incompatible with the stated agenda of levelling up the country.
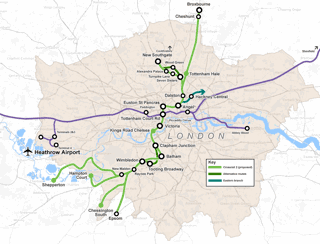
Figure 7 Crossrail 1 and Crossrail2 Greater London Wikimedia © Cnbrb
Transport analysis
Professor Allan J. Brimicombe is a Professor Emeritus at the University of East London, from the Centre for Geo-Information Studies, and is a Chartered Geographer. His analysis of the Elizabeth line is below, which draws on the parallels between Crossrail and his London 2012 Olympics impact study for the IOC.
Railways were, from their invention, a key component in industrialisation by stimulating heavy industries. The focus was on bulk transport of raw materials such as coal and iron and the distribution of manufactured goods. The railways reduced the cost of transportation and increased economic productivity. Today, modernising our rail network is primarily about faster and more efficient movement of people as well as minimising air pollution and CO2 emissions from transport. Recouping the cost of rail infrastructure projects is less about ticket sales (though these do produce immediate revenue) and more about stimulating longer-term economic growth that results in increasing tax revenues. However, when considering the net benefits of an infrastructure project, one has to compare with the counterfactual, that is what would have happened anyway without the project.
London's Underground was conceived as joining the City with the burgeoning number of railway terminals. The network was incrementally expanded to the increasingly distant suburbs as London grew. But heavy rail (main line) services did not pass through London, only to London. Passengers wishing to cross London and continue their journey on another side would need to change terminus, most efficiently via the Underground. However, in 1988 the Thameslink line was opened to allow through main-line services from Brighton via Gatwick Airport and the City to Luton Airport and Bedford. Meanwhile the Canary Wharf area was growing as London's second Central Business District and in 2003 London won its bid to host the London 2012 Olympic Games and Paralympic Games to be sited at Stratford. East London was growing in economic potential. In the west, a technology corridor had been developing along the M4 anchored in Reading at one end and Bristol at the other. There was thus an impelling logic for the Crossrail project (now Elizabeth Line) to have joined-up, through London rail services along an East-West axis.
For London 2012, some £7bn was spent on new and improved transport infrastructure, most of this being rail. This included amongst others: the Jubilee Line upgrade, Piccadilly line extension to Heathrow, the Heathrow express from Paddington, the Channel Tunnel rail link, upgrades of the North London line and London to Weymouth and the upgrade of the entire Docklands Light Rail network. The entire infrastructure project with its many elements needed to be completed, tested, and commissioned before the Opening Ceremony on 27 July 2012 otherwise it would have lost its point. There was thus a real 'can do' spirit around the preparation for London 2012. Wider economic benefits post-games were going to accrue. But looking at the counterfactual, just about all the improvements to the rail infrastructure were in the pipeline anyway and were accelerated for London 2012. The net economic benefit was about six years lead.
Many facts about the Elizabeth line and its construction are given above. The counterfactual is that main line services between Paddington and Reading, Liverpool Street and Shenfield, London Bridge and Abbey Wood and the Heathrow Express were already available. The construction of the tunneled sections will integrate these services and bring them to the heart of London. Thus, an estimated 35% of future employment growth that had been projected for London will be located in areas served by the Elizabeth Line: the West End, the City and Canary Wharf. It frees platform capacity at Liverpool Street and Paddington for more main line services, and the Heathrow Express is integrated into the Underground network. This potentially has considerable economic benefits for London, but the project has been four years late with an escalating cost. During the COVID-19 pandemic, work patterns have changed with easier working from home for office-based employees due to better technology. Passenger numbers in 2022 are yet to recover to pre-pandemic levels and may not do so for some time to come. Immediate ticket revenues will be down and growth in economic benefits are likely to be slower.
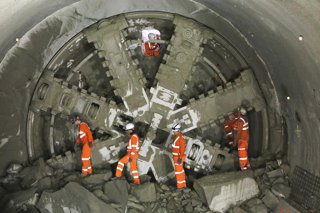
Figure 8 TBM Elizabeth and Victoria arrive at Farringdon © Cross rail
Crossrail analysis
Professor Tim Schwanen is a Professor of Transport Geography and the Director of the Transport Studies Unit at the University of Oxford. His research concentrates on the geographies of the everyday mobilities of people, goods, and information. Tim is a Supernumerary Fellow in Geography at St Anne's College.
The Elizabeth Line is a long overdue adaptation of urban rail services to the changed geographies of living, working and leisure in and around London. With the growth of London and the rise in housing prices and rents, more and more households have moved to (somewhat) less expensive locations across Southeast England. Until now, individuals in such households would have to first use relatively expensive train services provided by private companies before transferring onto tube trains run by Transport for London (TfL) for the London part of their journeys. Once the whole Elizabeth Line is in use, public transport journeys from and to places between Reading in the west and Abbey Wood or Brentwood in the east will become more convenient. In much of Central London the new line will also add much needed capacity to the tube network, particularly at peak times.
The effects of the new line on wider transport systems across and around London should not be exaggerated, at least for the coming decade. There may be small shifts away from car use to public transport, particularly for trips that start or end outside Central London. But noticeable changes in road congestion levels in or around London seem unlikely. The main benefits will occur in the rail system, and especially in decades to come. The line allows Greater London’s urban rail network to accommodate the projected long-term population growth and to avoid further overcrowding of tube services and trains in the future. In this way it may diminish the long-term growth of car use in the period up to 2050.
Not everybody will benefit from the new line, however. A look on the map will show that the Elizabeth Line does little to address the historic undersupply of metro and rail services in Central London boroughs on the South bank of the Thames. It is also likely that the new line will increase housing and real estate prices in locations outside London that can now be accessed much more quickly from Central London. Some of this price premium has already been priced in current prices, and it is now unclear how big the total premium will be in, say, a decade from now. It is nonetheless fairly certain that housing affordability issues in locations along the new line will not diminish, particularly for households on a low income. Small businesses looking for office or other kinds of space in those locations are also likely to face higher rents than they would in a situation where the line had not been built. Finally, many Londoners and people in surrounding communities cannot afford to travel on the tube or on trains operated by private companies or TfL, even if they wanted to. The benefits of easier and more convenient travel between Reading in the west and Shenfield or Abbey Wood in the east will be distributed unevenly across social groups. Substantial parts of the population in the area between those stations will be excluded from the benefits that use of the Elizabeth Line will bring.
The social and spatial uneven distribution of the benefits of the Elizabeth Line are not so much a consequence of the new infrastructure as such. It rather reflects a long history of political decision-making about how public transport is funded and provided in England and the limited integration of transport planning with housing and land use policies in the UK. This point highlights the importance of placing transport infrastructures in their social and political context.
Activity
1. Why is the Elizabeth line a “once in a generation” infrastructural development?
2. Create an ArcGIS map on Crossrail. To do this complete the following steps:
You do not need an ArcGIS account (but if you do have ArcGIS Online for Schools, please log in).
Search for Atlas layers or click ArcGIS Living Atlas of the World.
Click the Browse button in the ribbon to the top of your screen.
Search for “crossrail”.
Click “Crossrail Route” and then “Open in Map Viewer Classic”.
Use the measuring tool to work out how much of the line required tunnelling.
3. Using your map from question 2, now add to it to allow analysis of the Elizabeth line stations.
Click +Add and search “crossrail” again. Select Crossrail Stations and add the data (little green dots) by clicking ⨁.
Next, search “deprivation data” and select Index of Multiple Deprivation 2015 by EsriUK_EducationTeam (green and red choropleth map). Overlay this data layer onto your map.
Hit the back arrow to return to your Content legend. Click on the three dots … of Crossrail Route and Crossrail Stations and click “h Move up”. This will bring these layers to the top of your map.
Identify how many stations have been built in areas with a deprivation decile of less than 4 (any amber, orange, or red colour). Can it be argued that Crossrail has been built to connect deprived areas of the SE to central London?
4. Give two reasons why you think it took so long for Crossrail to be realised.
5. The Canary Wharf Group contributed £150 million towards the cost of the Canary Wharf station for the Elizabeth line. Explain why you think the Group chose to contribute to the project.
See article download for answers and data
Further reading
-
BBC Bitesize Studying changes of a major UK city - London
-
KCL News London's future trajectory is hard to predict, but we shouldn't plan for decline
-
Statista The UK economy – Statistics & Facts
-
City AM London and southeast now accounts for £4 in £10 of total UK economy
-
Crossrail Project YouTube What is the Elizabeth line?
-
The London Transport Museum The Elizabeth line
-
The Times Digging inches from disaster: how they built the Elizabeth Line
-
BBC News Crossrail: The monster tunnelling under London streets
-
Canary Wharf London’s Elizabeth Line 'a game changer' says transport chief
-
McKinsey & Company Transit investments in an age of uncertainty
-
FT The last metro? Crossrail and the uncertain future of urban transit
This resource was first published in 2022.