Mapping land-use change in Great Britain over the 20th century
Andy Suggitt and Alistair Auffret explain how a chat over coffee, whilst working as postdoctoral researchers at the University of York, ultimately led to them mapping and quantifying land use change in Great Britain from the 1930s to today.
What story does this visualisation tell, and why was it created?
was an important piece of work led by former President of the Royal Geographical Society and of the Institute of British Geographers, , and powered by the efforts of volunteers, many of whom were schoolchildren. At the beginning of the 1930s, Stamp observed that land use was beginning to change substantially, as the third agricultural revolution took hold in Great Britain. In a coordinated system of surveys using a standard methodology, his team documented the use of land in incredible detail, mapping right down to the field scale, and often finer.
We thought that if we could digitally classify these historical maps, we could then compare them to maps derived from satellite data we would be able to quantify land use change in Britain from the 1930s until today.
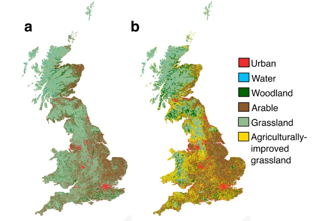
Figure 1 - Land use was mapped for (a) the historical time period (LUSGB 1930−40s, copyright Giles N. Clark) and (b) the modern time period (LCM 2007) at 25mx25m resolution in broad land-use categories.
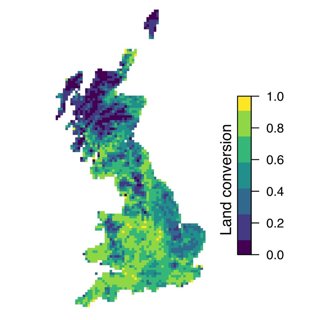
Figure 2 - ‘Land conversion’ map, where values indicate the proportion of 25mx25m pixels within each 10kmx10km square that changed category between the two time periods, interval ~75 years.
Who was the intended audience?
This project to digitise and georeference the maps was largely an academic one, however we knew that there would be a very wide audience for the maps amongst the public. People are hugely interested in maps of where they live, especially if those maps tell them something they didn’t know or reaffirm something they have long suspected. We took an ecological focus for the paper we wrote to introduce the map, but over time the people that will use the map are just as likely to have history, social science, or human geography in mind.
How did you use the data, what methods and techniques?
We worked with a team of scientists and geographers to scan the land use survey maps, georeference them, and mosaic them into a digital map of land use as it was in Stamp’s time. We then determined the land-cover category of each pixel in the scanned maps according to their RGB (red, green, blue) values.
For a modern day land use comparator we used the from the UK Centre of Ecology and Hydrology, which used a largely automated method to classify satellite data into 23 land cover classes. The historical map digitisations, originally generated at the 1:63,360 scale, were then resampled to 25x25m pixel size of the modern, satellite-derived equivalent LCM through the raster package in RStudio. To ensure the accurate comparison of the of the LCM and the LUS, we pooled the categories from both surveys which meant we could then compare land cover in each pixel. Finally we mapped the level of change (the proportion of pixels that had changed category) in each 10x10km grid square for the whole of GB which is demonstrated by of land conversion (Figure 2) telling us where, and by how much, land use changed in Great Britain over the 20th century.
Why did you choose to present the data in this way over other approaches?
There are a few good reasons why we opted for the land conversion metric, and why we calculated it at the specific resolution of 10x10km.
First, although we were able to create a coherent raster map of land use for the LUS at the 25x25m resolution (that of the CEH land cover map), errors associated with georeferencing, and the semi-automatic classification technique meant that the change maps at that scale would not be sufficiently reliable.
Second, before 1970 most of the biological recording conducted was carried out at the 10x10km ‘hectad’ level. Because our overall goal was to understand how land use and climate change has affected biodiversity, it was a natural choice for us to produce our change map at this resolution.
Third, the original maps are still protected under copyright, and will be until 2036 (70 years after Sir Dudley Stamp’s death). The revenue generated from companies purchasing access to LUS map sheets funds important work in the digitisation and curation of many thousands of historical maps. We were very happy that the current copyright holder could see the value in our summaries at the 10x10km level, and therefore allowed us to publish them open access.
How could the work be used?
Global biodiversity is in decline, and we are interested in understanding the relationships and interactions between land use change and climate, and how these phenomena could be driving this loss.
To do this we needed to quantify how land use has changed over the sorts of spatial and temporal scales that are relevant for studying climate change. (from which the images we present here are taken) focused first on presenting the patterns of land-use change in Great Britain, before looking into its effects on species of birds, butterflies, macromoths and plants. We showed that both land conversion and climate warming created both winners and losers across the UK biota, favouring generalist species in particular. In another new paper, we showed that high levels of land conversion were associated with landscapes losing their biological uniqueness.
About the creators
Andy is an Assistant Professor in the Department of Geography and Environmental Sciences at Northumbria University. His research examines the effects of environmental change on the natural world. He is a Fellow of the Society. You can find out more about Andy’s work on his or his Twitter .
Alistair is Senior Lecturer in Landscape Ecology at the Swedish University of Agricultural Sciences and is still trying to understand how historical changes in land use and climate interact to shape biodiversity today. You can find out more on his .