Mapping the extent of research into biodiversity hotspots
In this Geovisualisation feature we spoke to Emma Underwood, a PhD researcher at Kingston University London, who is exploring how the regions where certain plants can grow – their terrestrial range – are changing in response to climate change.
What story does this visualisation tell? Why was it created?
Species are altering their geographical, latitudinal or elevational range in response to climate change, land cover change and other disturbances. We call this range shift.
Research into ecological range shift has increased in recent years as scientists attempt to understand responses of species to both environmental and human-induced change. However, gaps in this knowledge remain and we need to understand these better to focus research.
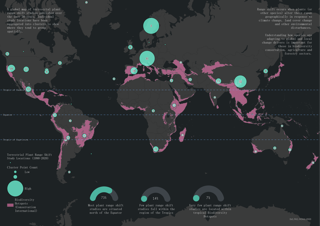
This visualisation is a summary of our investigation into research on plant range shifts published between 1990-2020. The images show the sites that have been studied. The size of the circles represents the number of studies we found in a region; larger circles highlight a higher density or “cluster” of research. The pink areas represent biodiversity hotspot regions. These areas are home to the richest and most threatened plant and animal life on Earth.
Our analysis shows the majority of plant range shift research has taken place in landscapes in Europe, North America and Asia, but few places in the Global South. Although 45% of all plants on Earth are found in biodiversity hotspots (pink areas), only 28% of plant range shift studies focus on these areas. Half of all biodiversity hotspots are situated in the tropics, yet only 7% of all research was undertaken there.
We created this map as part of a wider research study on the future for biodiversity hotspots. This is part of my PhD at Kingston University London, under the supervision of Dr Kerry Brown, Prof. Nigel Walford and Prof. Mark Mulligan (King’s College London).
Our next steps are to develop computer models that accurately predict range shifts of endemic plant species in Madagascar.
What data did you use to create it and why? Why did you choose to present the data in this way over other approaches?
We synthesised information on terrestrial plant range shift from 294 peer-reviewed journal articles published between 1990-2020. You can synthesise your own data and topic in a similar way, if the field locations are known. You can find out more about this in our story map.
These sites were plotted, using ArcGIS Pro, and then clustered together to show the general trends using the Aggregation tool. Although we can plot the individual sites, we found this aggregation works for us, as some studies covered a small area of land or species, whereas other studies included thousands of plants across multiple countries.
We also show biodiversity hotspots on this visualisation, which were downloaded from Global Forest Watch and Conservation International. The term was first coined by Norman Myers in 1988 but regions have since expanded as more boundaries have been added as these Hotspots are under increasing threat.
What impact has the visualisation had in research, policy or other contexts?
Most range shift studies aim to supply evidence on the impacts of climate change for conservation, forestry and invasion management purposes.
Accurately predicting and monitoring changes in plant distributions within fast changing landscapes is important for informing government, conservation, agroforestry, and food security sectors, all of which have vested interests in ensuring future plant survival. Additionally, the plant species under threat are often socio-economically and culturally important to its region.
This analysis will be published in 2022 and will provide evidence for anyone in working on these topics.
The project poster was displayed at British Ecological Society’s Ecology Across Borders 2021 and won best poster at GIS Research UK 2022 (GISRUK). The accompanying story map won the Esri UK Jack Dangermond Young Scholar Award 2022 and will be on show at the 2022 Esri User Conference in San Diego.