Maya Archaeological sites in Belize and Guatemala
Leila Donn, a PhD student at the University of Texas in Austin, created a visualisation using LIDAR to predict where caves could be found at several Maya archaeological sites. Here she discusses how she put the visualisation together, the impact it has had in terms of archaeological conservation priorities and how you can create something similar.
Explainer
What story does this visualisation tell?
This visualisation tells the story of two years of searching for caves at Maya archaeological sites in the dense tropical forests of Belize and Guatemala. This search began as a manual inspection of high-resolution LIDAR elevation imagery to identify areas that looked like they had the right topography for caves. We’d spend all day hiking off-trail to get to these areas, but more often than not there weren’t any caves there! So, while this was fun, it wasn’t particularly efficient.
It was on one of these hikes that I had the idea to teach the computer about the topography and landscape surrounding known cave sites, to help me find new caves in these areas. It was from this idea that my machine learning dissertation work began. This has now developed into a search not only for these caves but also for Maya structures that are obscured by vegetation and not readily visible to the bare eye.
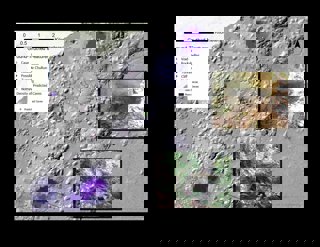
I created this image to provide a comparison between areas that my machine learning cave model said that caves were likely and the results of my summer 2019 ground-verification work.
Who was the intended audience?
I initially created this visualisation for a geological conference last year which I was presenting at. It was initially intended for an academic audience, but the research received some press attention too from the non-academic media, so the image was also shared more widely beyond the conference too. I think the press got interested in the project because of both the novelty and the adventure of the project. Caves are mysterious and people are curious about them. Most people don’t really ever get the opportunity (or have the desire!) to see one up close and in person. The first field season that I was working on this project we actually had a National Geographic film crew working on an archaeological documentary nearby. They heard that we had found a new cave and come out and joined us for a day. So in 2019 I ended up in about 15 minutes of a National Geographic documentary with the mysterious-sounding name of “Lost Treasures of the Maya: Secrets of the Underworld.”
What data and/or approach did you use to create it and why?
The basemap is a LIDAR digital elevation model hillshade that makes the topography readily visible. The predicted cave points show the coordinates that my model predicted as areas that have a probability of being a cave site. Since there were so many of these and I had limited time to verify them on the ground, I clustered these points by density so that I could focus on areas which has the highest density of cave predictions. The ground-truthed features are the cave model predictions that I verified on the ground during the summer of 2019, and they are classified by feature type.
Why did you choose to approach it this way over other approaches?
Machine learning offered a more efficient way to narrow in on areas with potential caves, rather than manually choosing areas to explore. The first step in this workflow was to gather a training dataset of known caves. Since it’s important that the model recognises caves and is able to differentiate these from other types of topographic features, I also generated a number of points to represent background topography. The caves and background topography points represented my training dataset to teach the model to identify caves.
From there, I generated a number of raster layers designed to capture cave morphology such as slope and aspect, etc. I then used Python to create a matrix of these morphological values for my cave/background topography training dataset. From there, I input the matrix into a random forest classifier that classified each training data point as cave or background topography based on the associated morphological values and associated class label. Once the classifier was fully trained, I was able to use the values that it determined to be associated with caves to make predictions over new areas of LIDAR.
I then generated a graphic of the predicted locations of caves, so we could aggregate predicted caves by density of predicted occurrence and focus our fieldwork on those sites. After completing fieldwork, I added in ground truth data classified by type of feature we found, cave or otherwise.
What impact has the visualisation had in research, policy or other contexts?
Since the idea of using machine learning to find caves is new, we weren’t sure it was going to work, but this image shows that it does!
Initially, I was just focusing on finding caves at these archaeological sites, but as the archaeologists that I work with heard about this work and saw this visualisation, they began to ask if I could use machine learning to find other new archaeological features as well. This has led to an expansion of my machine learning work to include models designed to identify Maya archaeological features and even some ancient burial mounds in Romania.
This work helps to create a more complete map of cultural heritage features, which enables development of conservation priorities. Additionally, identifying previously undocumented caves can also help to identify new archaeological sites and even new speleothem climate records for this region.
Alongside this, I’ve also been approached by other geologists who are keen to learn more about how this type of modelling could be used for geological mapping.
How else might this approach or data be used? How can the visualisation be taken a step further?
This approach can really be used to find almost any kind of feature of interest, whether archaeological or ecological. I am currently putting my machine learning skills and research to use at an internship with the Naval History and Heritage Command Underwater Archaeology Branch. Additionally, the final chapter of my dissertation actually ventures into ecology with a model that predicts both a certain species of pine tree and how affected it is by a particular species of invasive pine beetle. This model uses both hyperspectral imagery collected by UAV and satellite multispectral imagery.
Try it yourself
To create a similar style of visualisation you’d need an appropriate type of remotely sensed imagery like LIDAR or multispectral imagery at a sufficient spatial resolution to identify whatever it is you are looking for – so if you’re looking for something that’s just a few meters wide, you might want one metre resolution data compared to larger geological features that might accommodate data that has a 10 metre or even lower resolution. Both NOAA and OpenTopography are great sources for open-source DEM and spectral data, much of which is at high-resolution.
Additionally, you’d need a training dataset composed of known locations of the features you’re interested in. You would need to have some Python programming language skills and also be comfortable using GIS (ArcGIS, open-source QGIS, etc.). Leila really loves a website called Machine Learning Mastery, which she refers back to incredibly often and is a great starting point for a first foray into machine learning.
If you’re not confident with Python, Leila suggests eCognition, which can also do some of this kind of work.
About the creator
Leila Donn is a PhD student in the Department of Geography and the Environment at the University of Texas in Austin.
After graduating with a BS in Geology, Leila worked as a geologist for a number of companies and as an Environmental Specialist for the Tennessee Department of Environment and Conservation. Her current work, creating a series of aerial imagery based machine-learning models, helps to develop methods of understanding, monitoring, and addressing landscape change.
You can find out more about Leila and her work on her website and by following her on Instagram.