
Emily Selwood, Software Engineer at the Satellite Applications Catapult, created this visualisation which is intended to act as an early warning system for bridge deteriorations. Here Emily discusses why she created this visualisation, the data she used and how this approach could be expanded or applied elsewhere.
Explainer
What story does this visualisation tell?
This visualisation tells the story of the UK’s transport infrastructure and the maintenance of its vast network of bridges. Maintaining bridges is a huge challenge - the RAC Foundation claims that over 3,000 bridges in the UK are “substandard” and subject to weight restrictions or monitoring, a large number of which are in rural areas of the country. Repairs cost councils almost £600m in 2018, and bridges in need of repair can range from defective modern transport arteries and overused Victorian infrastructure to flood-stricken bridges hundreds of years old. This visualisation shows a new approach to monitoring bridges, which is intended as an early-warning system for bridge deteriorations
Why was it created?
Monitoring bridges with live inspections requires a lot of work. Remote monitoring of bridge condition could help identify bridges in urgent need of repair, or those starting to deteriorate without the need to visit the site. This visualisation was the product of the BRIGITAL project to help inspect bridges in remote areas of Canada, where remoteness of bridges means inspections may only take place every two years. SA Catapult developed the BRIGITAL tool with Canada’s National Research Council to analyse bridges in Montreal and potentially underpin a national early warning system.
What data did you use to create it and why?
The data is collected by earth observation satellites, which use a technology called Synthetic Aperture Radar (SAR). By combining data from several shorter antennae, SAR satellites can produce a high-resolution radar scan (up to 25cm in resolution) that would otherwise need a huge aerial. Data can also be collected through cloud cover, unlike visual imaging.
SAR has been used previously to map ground movements, when applied to bridges, it can show slight movements that could threaten the structure.
BRIGITAL uses satellite radar to visualise bridge structural safety, combining precise measurements from space with ground sensor and inspection data, then comparing measured movements with expected/predicted movements to identify emerging problems.
Why did you choose to present the data in this way over other approaches?
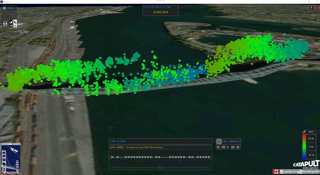
The data is initially structured as a point cloud, then as a 3D model. This allows clear visualisation of the data points along the structure of the bridge, which can allow potential problems to be located, helping to target visual inspection and maintenance work more efficiently.
What impact has the visualisation had in research, policy or other contexts?
In the initial application in Canada, the research team found that the studied bridges were behaving as expected with respect to local conditions and ground movement. This meant the bridge owners would be able to make better-informed decisions about management and repairs.
How else might this approach or data be used?
The technique underpinning Brigital, i.e. SAR Interferometry, can been used for the monitoring of several other infrastructures, such as buildings and dams, and for ground subsidence studies. Similar research and applications have included:
-
Analysing and modelling bridge collapses to identify risks, including analysis of the 2001 Hintze Ribeiro and 2017 Morandi Bridge collapses.
-
Monitoring the movements of Waterloo Bridge in London, including identifying some of the in situ limitations.
-
Risk assessment for tailings dams, including analysis of the Brumaldinho collapse.
-
Ground subsidence assessment for reclaimed land, such as the Rize case.
Try it yourself
This NASA page includes links to a range of SAR processing software, and various handbooks for working with SAR, and NASA EarthData includes SAR datasets. Alaska SAR Facilities also provide with several tutorials. A full online course on radar remote sensing is provided here.
About the creator
Emily Selwood is a Software Engineer working in the Geospatial Intelligence Group at the Satellite Applications Catapult.
You can read more about some of the projects Emily has worked on at the Satellite Applications Catapult website. You can also follow her on Twitter.