Measuring the healthiness of places to improve planning, public health and local government policy
Downloads
The Access to Health Assets and Hazards (AHAH) Index, created by geographers at the University of Liverpool, has enabled local councils to better target interventions and design policies to make places healthier. The Index has also been incorporated into an interactive geospatial data platform which explores indicators of healthy and unhealthy areas in Great Britain, making it easier to identify inequalities and share findings.
Challenge
The health outcomes of communities are often positively and negatively affected by environmental factors such as air pollution, access to health and other key services, distance from green space and distance from fast food outlets. However, it can be difficult to understand how these influences are geographically distributed and how they overlap, posing challenges for effective public health interventions at a range of scales and in different places.
Solution
Dr Mark Green and colleagues at the University of Liverpool identified four categories of lifestyle and environmental influences on health outcomes: access to retail outlets, access to health services, air quality, and access to natural environment. In each category, they identified both harms (e.g. access to fast food) and benefits (e.g. access to green space).
They then integrated wide-ranging data sets from the Consumer Data Research Centre (CDRC) and Public Health England for each of these categories to create the Access to Health Assets and Hazards (AHAH) index, which gives an indication of how healthy an area is to live in. The AHAH datasets are available freely via the CDRC.
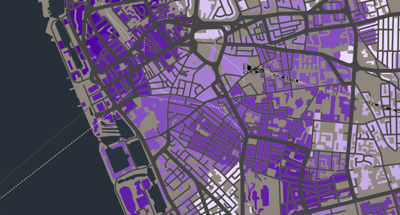
The data sets map onto Lower Super Output Areas (LSOAs) for England and Wales, and Data Zones for Scotland, enabling consistent comparison with other demographic data. The data sets are visualised on a map of the UK in an online platform, incorporating and allowing exploration of a range of indices.
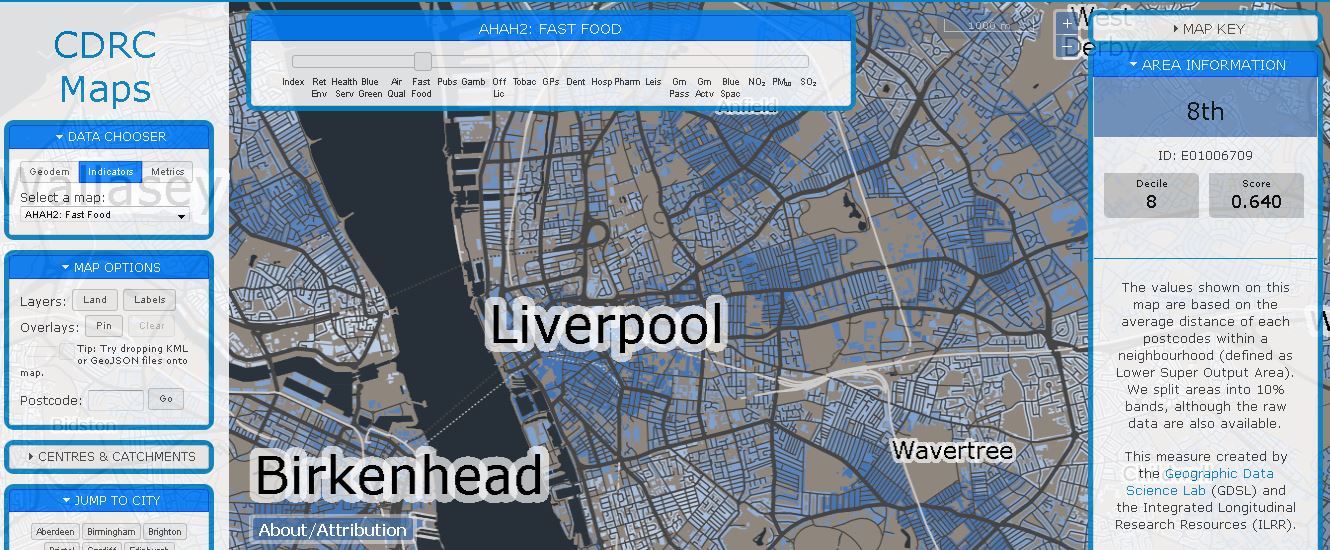
A screenshot of the tool from maps.cdrc.ac.uk
Benefits
Better decisions
Research using the AHAH Index measures has revealed that some rural areas are less healthy than supposed by highlighting underappreciated hazards or problems in those areas. Examples of this include high PM10 particulate pollution in Lincolnshire and poor access to health services in the north of Scotland.
Liverpool City Council used the research to inform discussions around planning and licensing fast food outlets. Council staff mapped existing fast food outlets in relation to school locations, then explored the potential of limiting for new outlets near schools. The draft Liverpool Local Plan produced in 2018 included a 400m fast food outlet exclusion zone around secondary schools. The researchers were also able to identify specific local areas which were under-served in terms of green space, and make policy recommendations around changes to the built environment to prevent obesity, informing Liverpool’s Healthy Weight Strategy 2018-2028.
Visualising data
The AHAH Index is incorporated into Public Health England’s Wider Determinants of Health tool as an indicator under Natural and Built Environment determinants. This means it can be used by researchers and the public as part of a holistic picture of demographic data and health outcomes across England.
The CDRC website makes the interactive map & geospatial explorer and the underlying datasets publicly available, enabling anyone to examine the healthiness of areas of the UK at a high resolution and across a number of domains (including their inputs). Download analytics indicate the data have been accessed by 407 Local Authorities in Great Britain.
Further reading
-
AHAH story from CDRC, demonstrating how visualisation of geographical data can help communicate geographical disparities and challenge received narratives about places.
-
More information about the AHAH project on the CDRC website
-
The data can be accessed and viewed here
-
The research paper by the project team on developing the index
Share this resource
This is an open access article under the terms of the Creative Commons Attribution License (CC BY NC 4.0), which permits use, adaptation, distribution and reproduction in any medium or format, provided the original work is cited and it is for non-commercial purposes. Please contact us for other uses.
How to cite
Royal Geographical Society (with IBG) (2020). Measuring the healthiness of places to improve planning, public health and local government policy. Available at www.rgs.org/healthyplaces. Last accessed on: <date>