Using modelling to understand journey times and jobcentre use
Downloads
Challenge
Understanding the geography of jobcentres is critical to making decisions over how and where to deliver services, and is a recurring challenge as policy is revisited under changing conditions and governments. The 2015 Spending Review required the Department for Work and Pensions to co-locate more JCP offices with other services and cut 20% of its estate.
Subsequently, the Work and Pensions Committee held a 2016 inquiry into the future of Jobcentre Plus, and in 2017 the DWP published plans to change how it used Jobcentre Plus offices and benefit centres around the UK. The DWP operated around 1.5 million square metres of office space, and suggested that 300,000 square metres could be vacated.
Plans to close, merge or move offices would have implications for staff and for service users, and decisions would be better informed with an understanding of impacts on accessibility and journey times.
Solution
The National Audit Office (NAO) is a Parliamentary body which scrutinises public spending. The NAO submitted a memorandum to the 2016 Work and Pensions inquiry, highlighting journey times to jobcentres by area across the UK as well as statistics on unemployment.
As a follow-up, the NAO created a model of journey time to jobcentre locations around the UK. This drew on four key data sources:
-
Output areas, the key building block of the Census and used widely to structure demographic data. The model used 171,372 English output areas, each containing on average 125 households.
-
Jobcentre locations from DWP data.
-
UC and JSA claimant numbers from ONS’s Nomis database.
-
Travel time between each output area and Jobcentre location, using the DfT’s metholodogy; this does not include service frequency.
The model included datasets both for the existing jobcentre locations in England as of 2015, and iterations of the DWP’s proposed cuts to jobcentres. In 80 cases the model used schools, GP locations and centres of employment as proxies where the DfT’s 2016 data set did not match jobcentre locations.
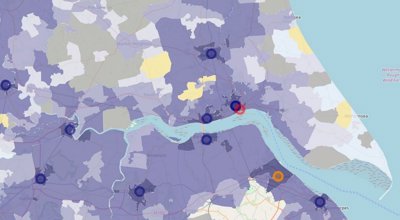
Ultimately, the NAO research combined and mapped travel time estimates from 171,372 English output areas (each around 125 households) to the nearest ten jobcentre sites, producing an interactive tool which can be viewed below and on the NAO website.
Benefits
Better decisions
The NAO’s work on Jobcentre locations and usage informed the Work and Pensions Committee inquiry into the Future of JobcentrePlus with suggestions for what the Committee might ask the DWP. The NAO’s memorandum analysis and data was heavily cited in the Committee’s final report.
The NAO also ran a blog post and produced an Audit Insight paper, which include discussion of limitations in the model, thus better contextualising the findings and implications of the work and model. Limitations included:
-
The use of output areas was not perfectly equivalent to where people actually live.
-
The model does not include capacity, costs or staff numbers of existing jobcentres.
-
Travel times involved some assumptions about mode of transport used (public transport), while not accounting for transport frequency.
Visualising data
The model provided a publically-accessible and intuituve tool to quickly and easily identify potential impacts of jobcentre closures and changes.
The NAO highlighted that the model work established a platform for future analysis that could direct cuts or additions to the jobcentre network based on demand and availability of jobcentre offices. The NAO highlighted how the analysis could be extended to a wider analysis of governmental service provision in the UK, including to “stress test the resilience of the overall estate design to future economic shocks”.
Sources and further reading
The NAO’s explanation of the model is available here.
An earlier NAO report from 2013 on Jobcentres under changing economic conditions.
A blog about the changing implementation of jobcentres, including changes after the development of the model, is available here.
The archived webpage from the journey time model work is available here.
Share this case study
This is an open access article under the terms of the Creative Commons Attribution License (CC BY NC 4.0), which permits use, adaptation, distribution and reproduction in any medium or format, provided the original work is cited and it is for non-commercial purposes. Please contact us for other uses.
How to cite
Royal Geographical Society (with IBG) (2019). Using modelling to understand journey times and jobcentre use. Case study [online]. Available at: https://www.rgs.org/jobcentres Last accessed on: <date>